Fig. 2.
Download original image
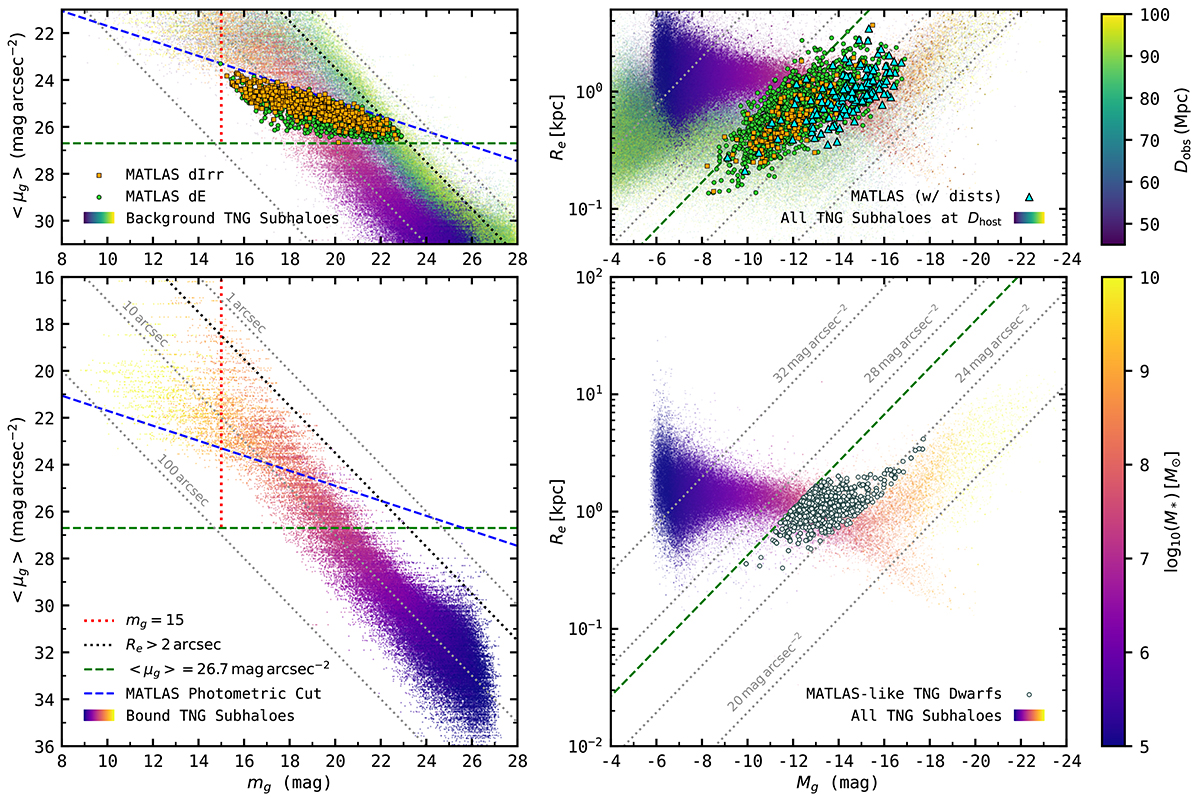
Scaling relations for MATLAS dwarfs and luminous subhaloes in the TNG50 simulation. Left: selection criteria for MATLAS-like dwarfs mock-observed in TNG50. The blue line indicates the linear cut between regular galaxies and dwarfs adopted in MATLAS (Habas et al. 2020). The green, red, and black lines respectively represent cuts on average surface brightness ⟨μg⟩, apparent magnitude mg, and apparent effective radius motivated by the distribution of the MATLAS dwarfs (see upper panel). The observed dwarfs demonstrate photometric properties consistent with their TNG counterparts, except for a population at larger mg than expected in the simulated ⟨μg⟩−mg relation. This discrepancy can be explained by assuming that a fraction of the MATLAS dwarfs are background galaxies with distances up to 100 Mpc. Right: physical properties of luminous subhalos in TNG’s mock-observed fields. MATLAS-like dwarfs that satisfy the selection criteria are indicated as white circles. Distances are not available for around 85% of the MATLAS dwarfs, and they are assumed to lie at the same distance as their field’s target host galaxy. The TNG dwarfs, when making this assumption, also follow a similar extended distribution in Re − Mg space. MATLAS dwarfs with known distances follow the true TNG distribution more closely.
Current usage metrics show cumulative count of Article Views (full-text article views including HTML views, PDF and ePub downloads, according to the available data) and Abstracts Views on Vision4Press platform.
Data correspond to usage on the plateform after 2015. The current usage metrics is available 48-96 hours after online publication and is updated daily on week days.
Initial download of the metrics may take a while.