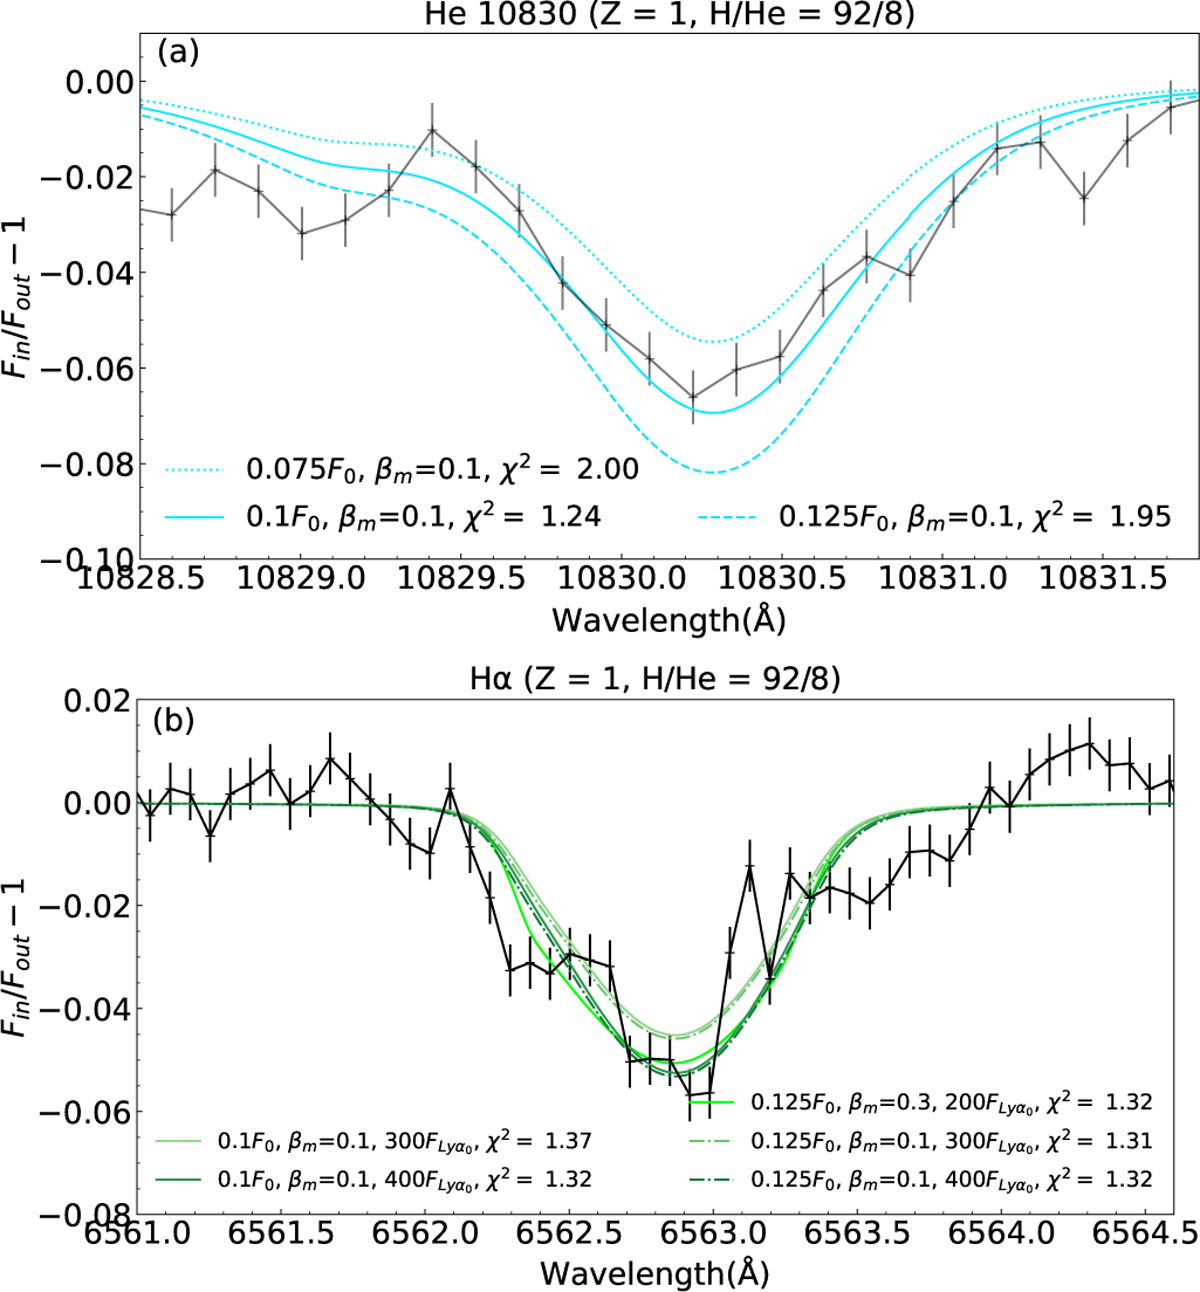
Fig. 2
Download original image
Comparison of He 10830 and Hα transmission spectra with the models that reproduce both the lines well with solar metallicity (Z = 1) and H/He ratio (92/8). In each panel, the label in the y-axis Fin/Fout − 1 is the in-transit flux over out-of transit flux minus 1, which represents the relative absorption depth. The legends show the model parameters and the values of χ The lines with error bars are the observation data from Czesla et al. (2022).
Current usage metrics show cumulative count of Article Views (full-text article views including HTML views, PDF and ePub downloads, according to the available data) and Abstracts Views on Vision4Press platform.
Data correspond to usage on the plateform after 2015. The current usage metrics is available 48-96 hours after online publication and is updated daily on week days.
Initial download of the metrics may take a while.