Open Access
Fig. B.3.
Download original image
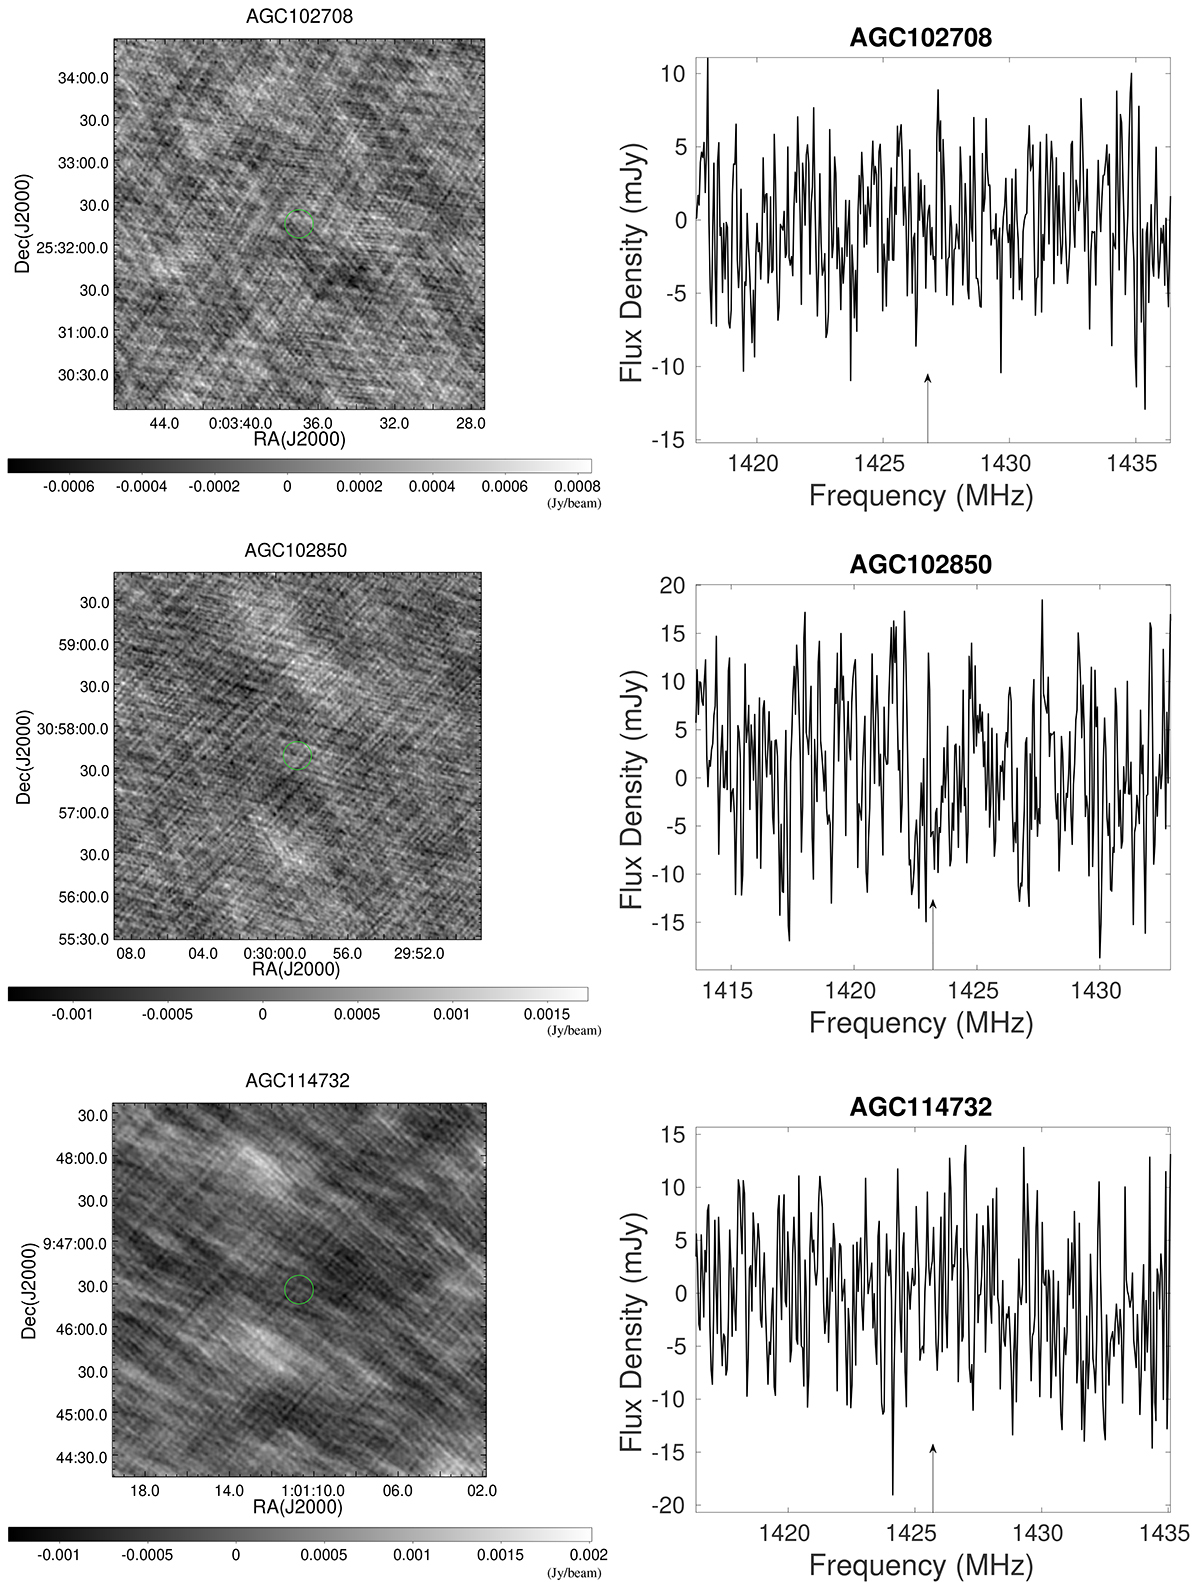
OH line profiles generated using the high-resolution GMRT-full. Left: The dirty map of possible OH line emission about 5 MHz bands centered at the peak frequency given by Haynes et al. (2018). The OH line profiles are mostly generated from green circles with size of about 20"×20" except for AGC219835, which is 40"×40".
Current usage metrics show cumulative count of Article Views (full-text article views including HTML views, PDF and ePub downloads, according to the available data) and Abstracts Views on Vision4Press platform.
Data correspond to usage on the plateform after 2015. The current usage metrics is available 48-96 hours after online publication and is updated daily on week days.
Initial download of the metrics may take a while.