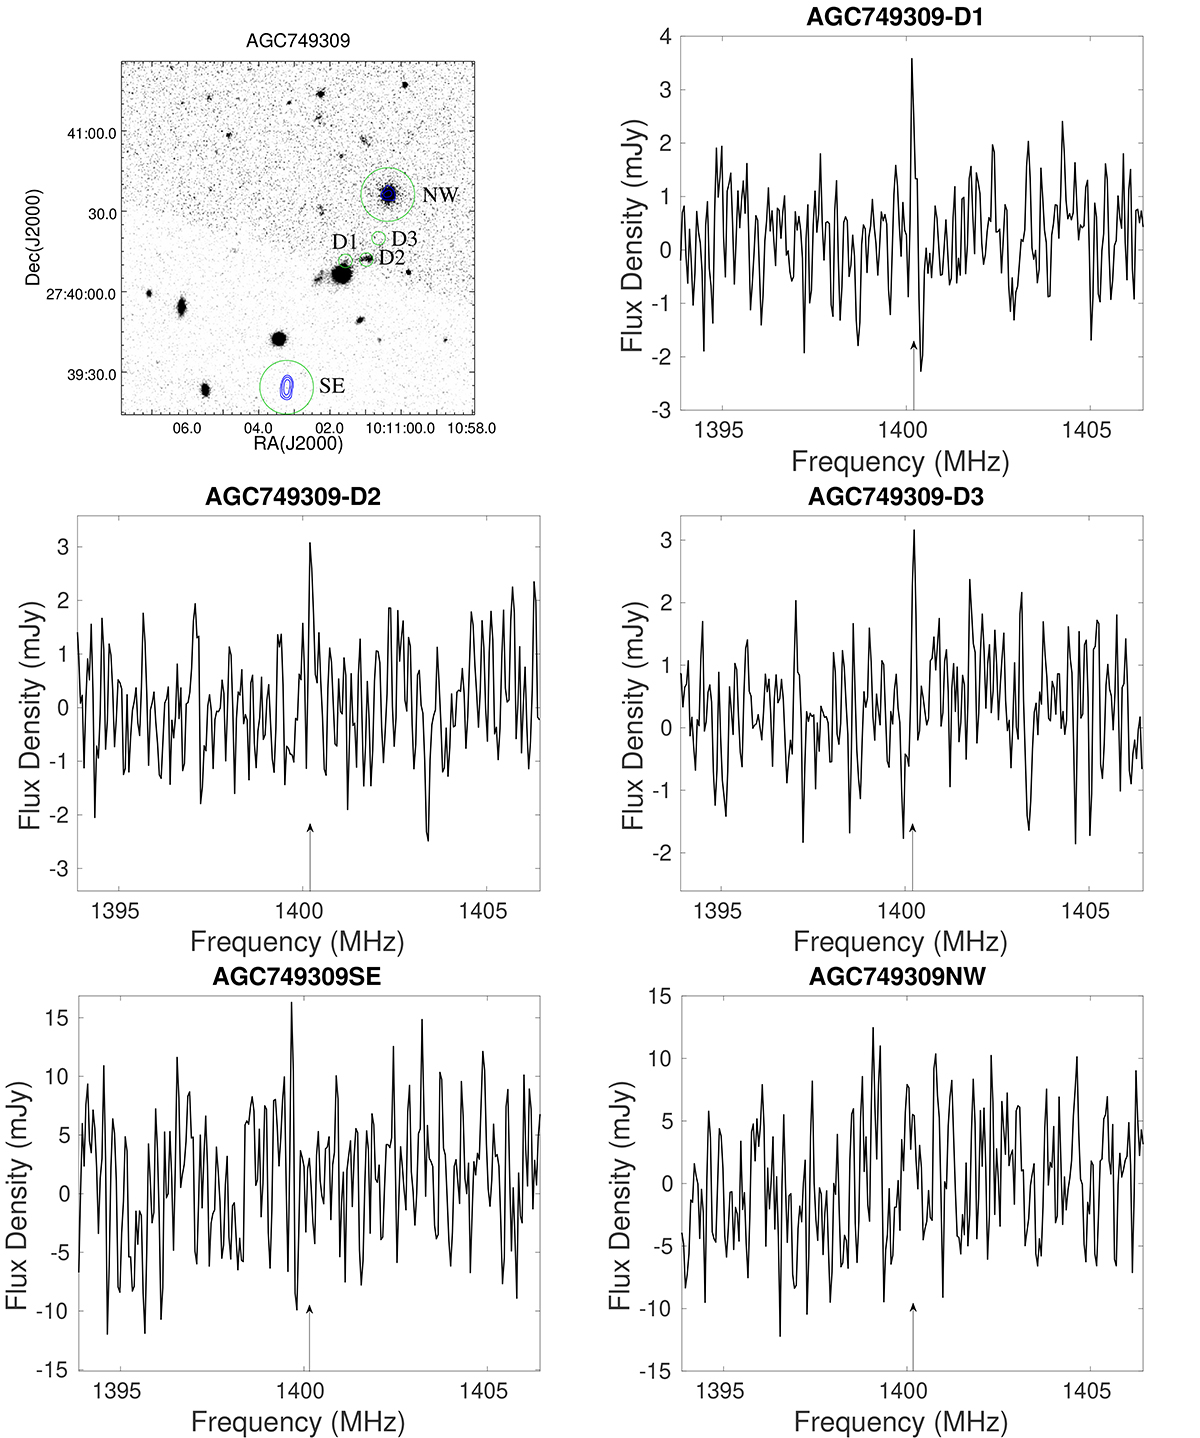
Fig. B.2.
Download original image
Radio line profiles of AGC 749309 generated using the high-resolution GMRT-full. Top left: the R-band SDSS image of AGC 749309. The green circles stand for the regions where we extract the spectral line emission. The size of the large and smaller cycles are 20"×20" and 5"×5", respectively. The extracted line profiles from these regions are present in other panels of this figure.
Current usage metrics show cumulative count of Article Views (full-text article views including HTML views, PDF and ePub downloads, according to the available data) and Abstracts Views on Vision4Press platform.
Data correspond to usage on the plateform after 2015. The current usage metrics is available 48-96 hours after online publication and is updated daily on week days.
Initial download of the metrics may take a while.