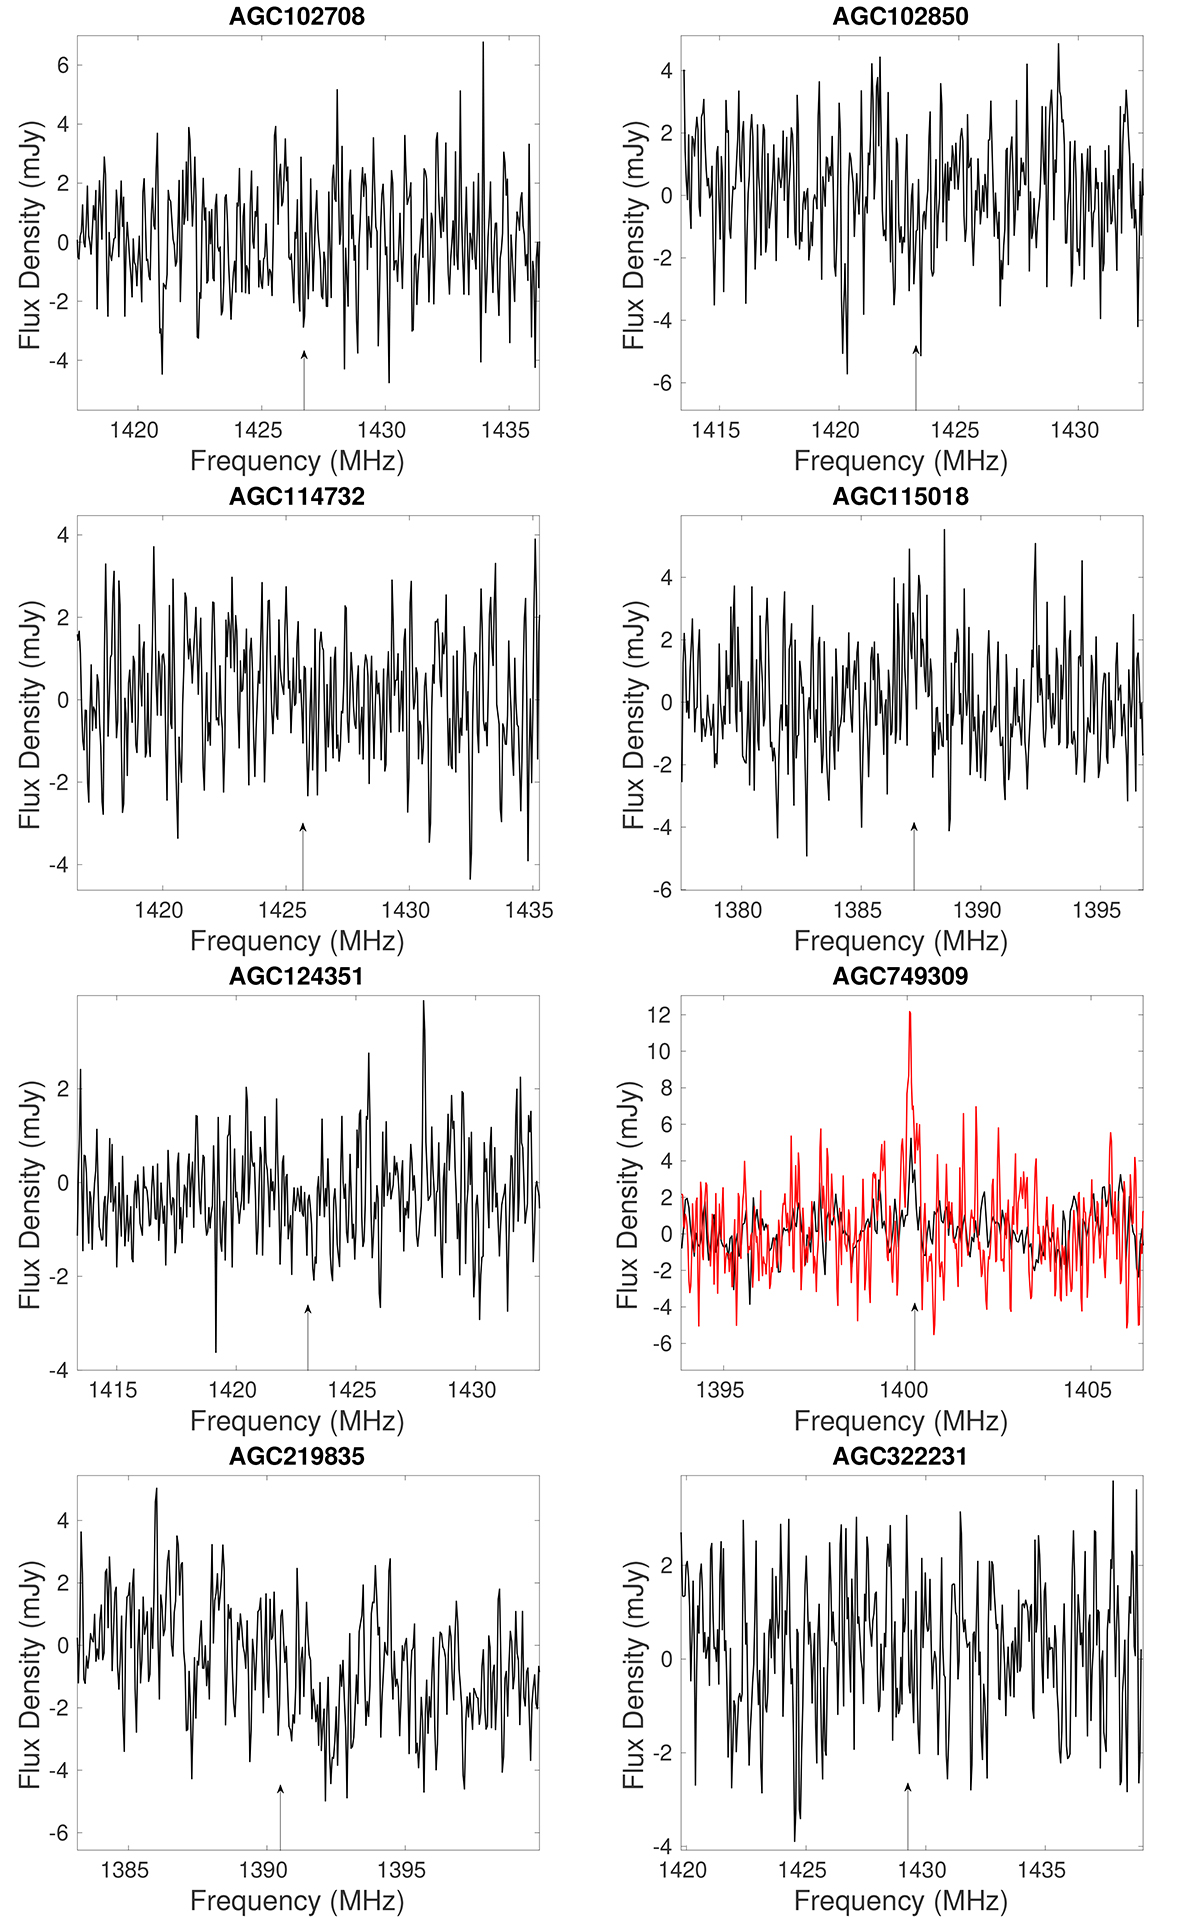
Fig. B.1.
Download original image
OH line profiles generated using the data from the low-resolution GMRT-central. The OH line profiles were extracted from a circular region with sizes of 60"×60" centered at the position given by Haynes et al. (2018; see Table B.1 and Fig. 1). The arrow represents the peak frequency of the line profiles given by Haynes et al. (2018). The red line profiles of AGC 749309 represent the ALFALFA spectra of this source from Haynes et al. (2011).
Current usage metrics show cumulative count of Article Views (full-text article views including HTML views, PDF and ePub downloads, according to the available data) and Abstracts Views on Vision4Press platform.
Data correspond to usage on the plateform after 2015. The current usage metrics is available 48-96 hours after online publication and is updated daily on week days.
Initial download of the metrics may take a while.