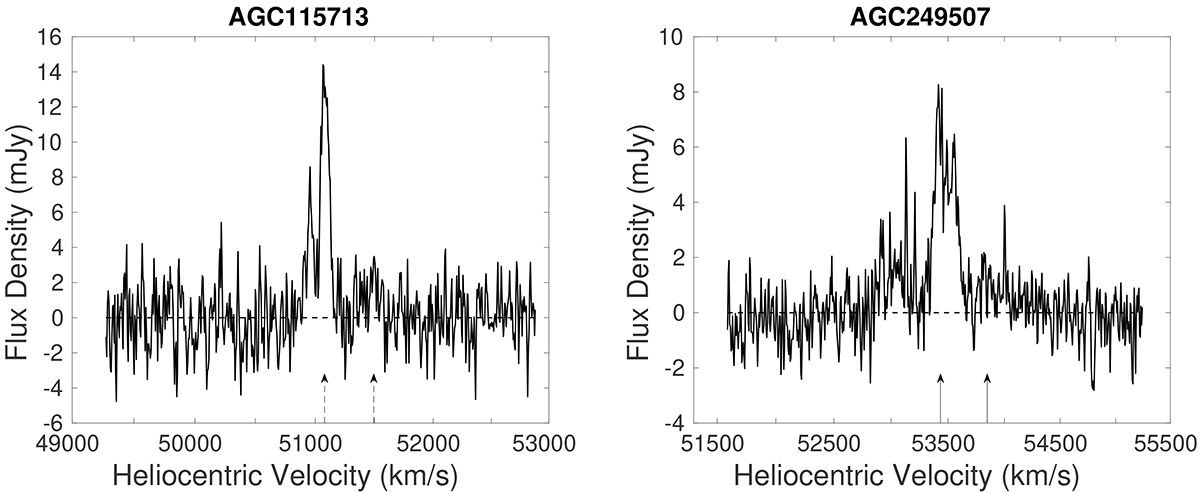
Fig. 2.
Download original image
OH line profiles of AGC 115713 (left) and AGC 249507 (right). For the spectra, the 1667.359 MHz line was used as the rest frequency for the velocity scale. Arrows indicate the expected velocity of the 1667.359 (left) and 1665.4018 (right) MHz lines, respectively. The arrow of the dotted line represents the expected velocity based on the redshift from OH line emission by Haynes et al. (2018). The arrow of the solid line is calculated by optical redshift from the LAMOST optical telescope survey. The OH line profiles of two sources were generated from a region about 7′′ × 7′′ and 5.65′′ × 5.26′′, respectively. The center coordinates and other parameters are listed in Table 2.
Current usage metrics show cumulative count of Article Views (full-text article views including HTML views, PDF and ePub downloads, according to the available data) and Abstracts Views on Vision4Press platform.
Data correspond to usage on the plateform after 2015. The current usage metrics is available 48-96 hours after online publication and is updated daily on week days.
Initial download of the metrics may take a while.