Fig. B.5.
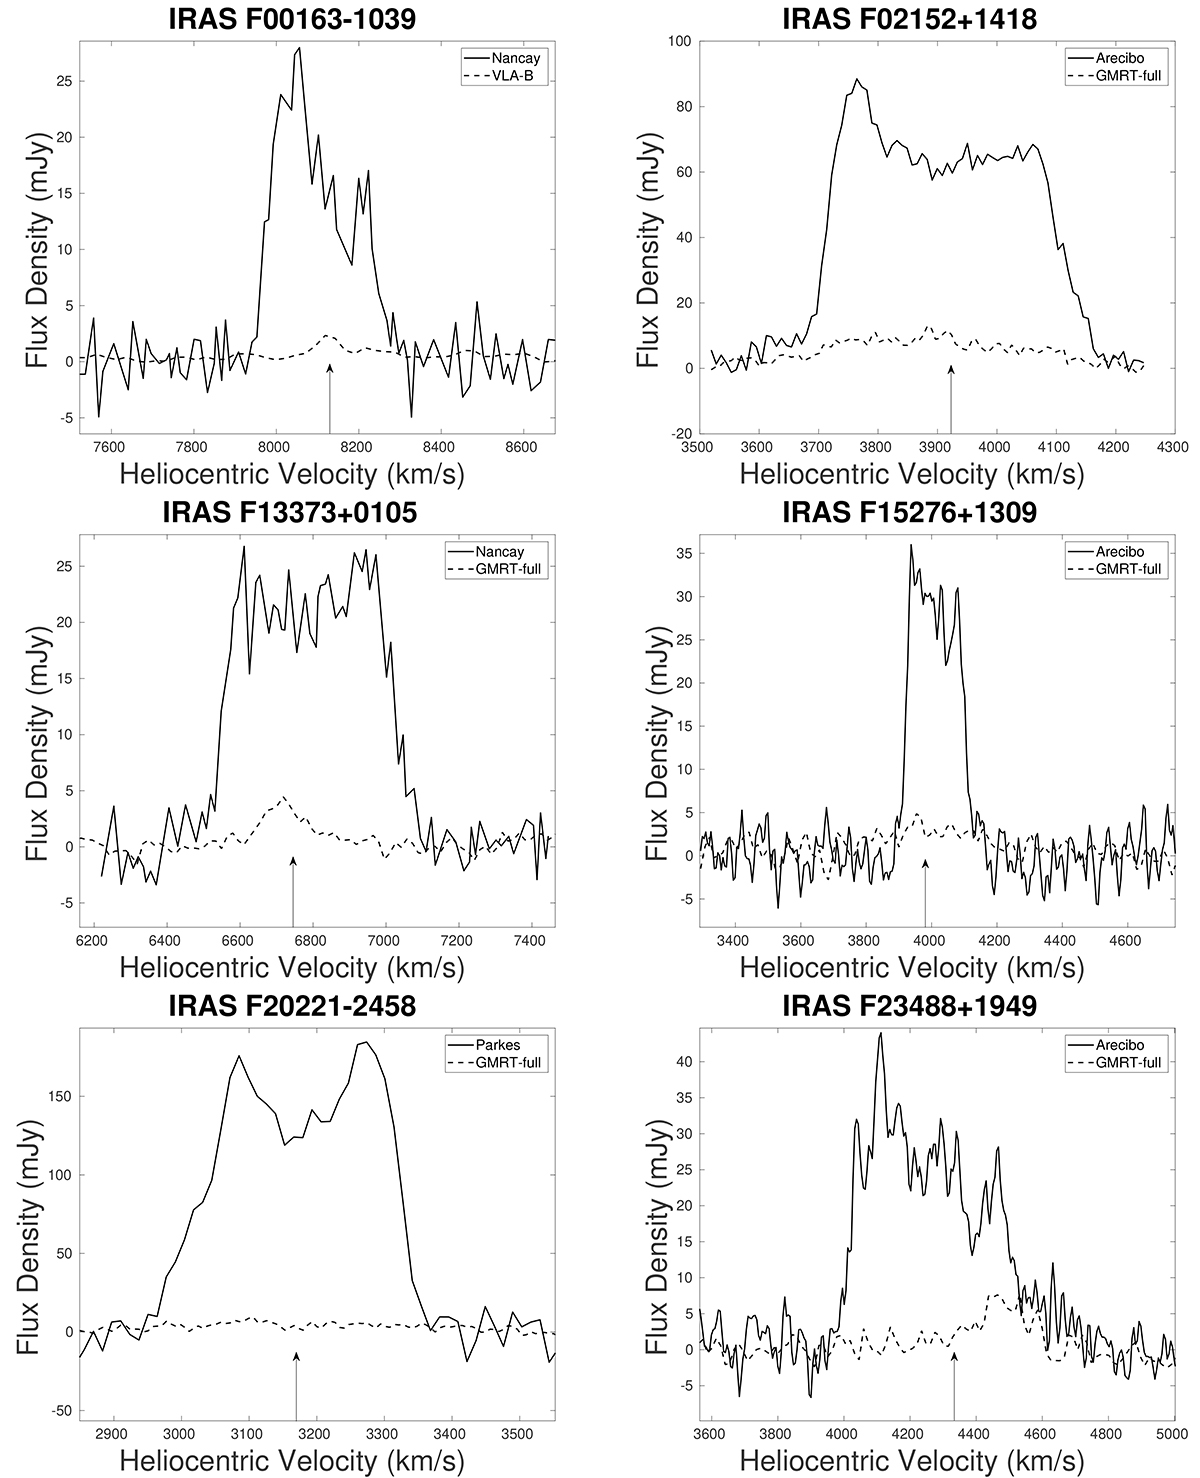
Download original image
H I line profiles of (U)LIRGs.The arrow in the plot indicates the systemic velocity. For the interferometric array, the H I line profiles are produced within a circular region of approximately 10"×10", centered around the nuclei center of these galaxies, as illustrated in Fig. B.4. Exceptionally, in the cases of IRAS F00163-1039 and IRAS F13373+0105, each possessing two nuclei, the line profiles are generated from the south and southeast nuclei of the two sources, respectively. The references for the single-dish line profiles can be found in Table B.3.
Current usage metrics show cumulative count of Article Views (full-text article views including HTML views, PDF and ePub downloads, according to the available data) and Abstracts Views on Vision4Press platform.
Data correspond to usage on the plateform after 2015. The current usage metrics is available 48-96 hours after online publication and is updated daily on week days.
Initial download of the metrics may take a while.