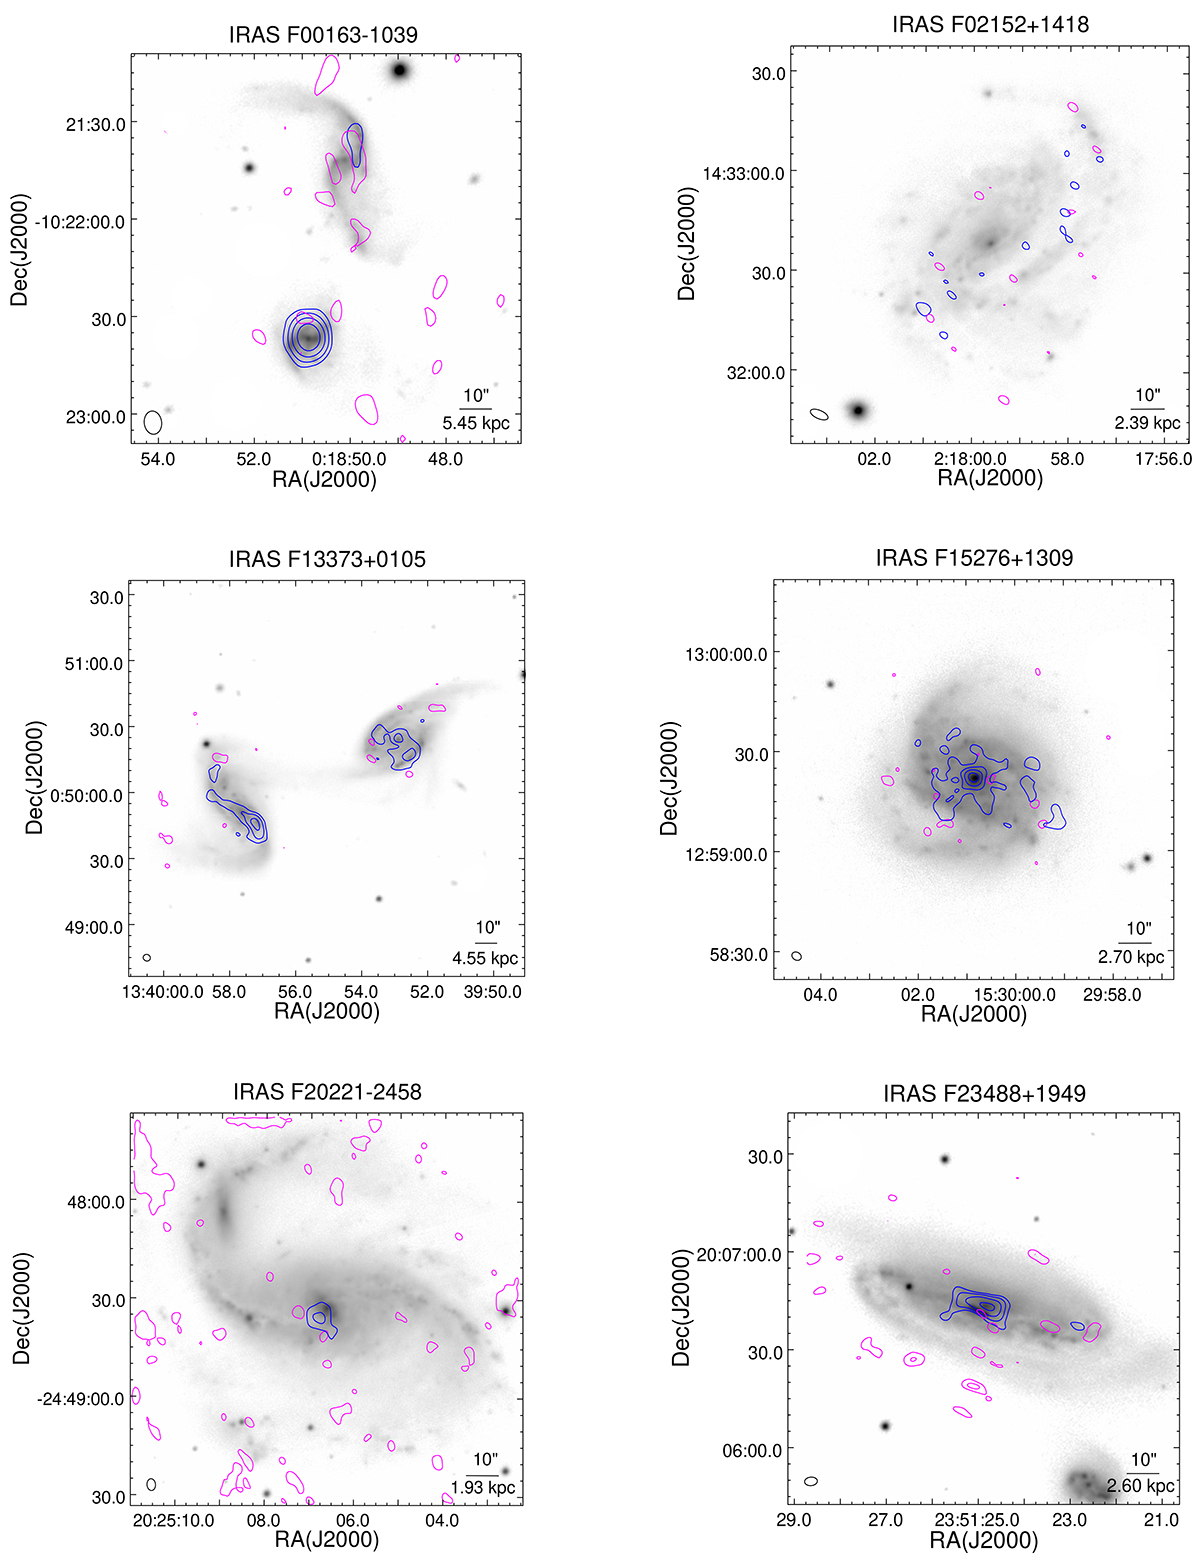
Fig. B.4.
Download original image
H I line and radio continuum emission overlaid on an optical R-band grey image (PanSTARRS). The magenta contours represent the integrated H I line emission in selected velocity ranges, as indicated in Fig. B.5. IRAS F00163-1039: 7998.06-8359.56 km s−1, IRAS F02152+1418: 3600-4200 km s−1, IRAS F13373+0105: 6425.81-6995.61 km s−1, IRAS F15276+1309: 3697.75-4277.18 km s−1, IRAS F20221-2458: 3011.4-3152.88 km s−1, IRAS F23488+1949: 4180.91-4626.35 km s−1. The initial contour levels for these sources are at the 2 σ level, with values of 0.368, 0.298, 0.154, 0.339, 0.439, and 0.433 mJy/beam, respectively. Only IRAS F23448+1949 has a second contour (2σ ×2), while other sources have only the first contour. In blue, the emission of the L-band radio continuum is depicted, with the first contour levels set at level 3 σ -specifically, 1.062, 0.992, 0.672, 0.765, 1.431, and 2.121 mJy/beam, respectively. The contour levels follow a pattern (1 2 4 8,...). The ellipses at the bottom left of each panel indicate the beam size of the interferometric observations, as depicted in Table B.3.
Current usage metrics show cumulative count of Article Views (full-text article views including HTML views, PDF and ePub downloads, according to the available data) and Abstracts Views on Vision4Press platform.
Data correspond to usage on the plateform after 2015. The current usage metrics is available 48-96 hours after online publication and is updated daily on week days.
Initial download of the metrics may take a while.