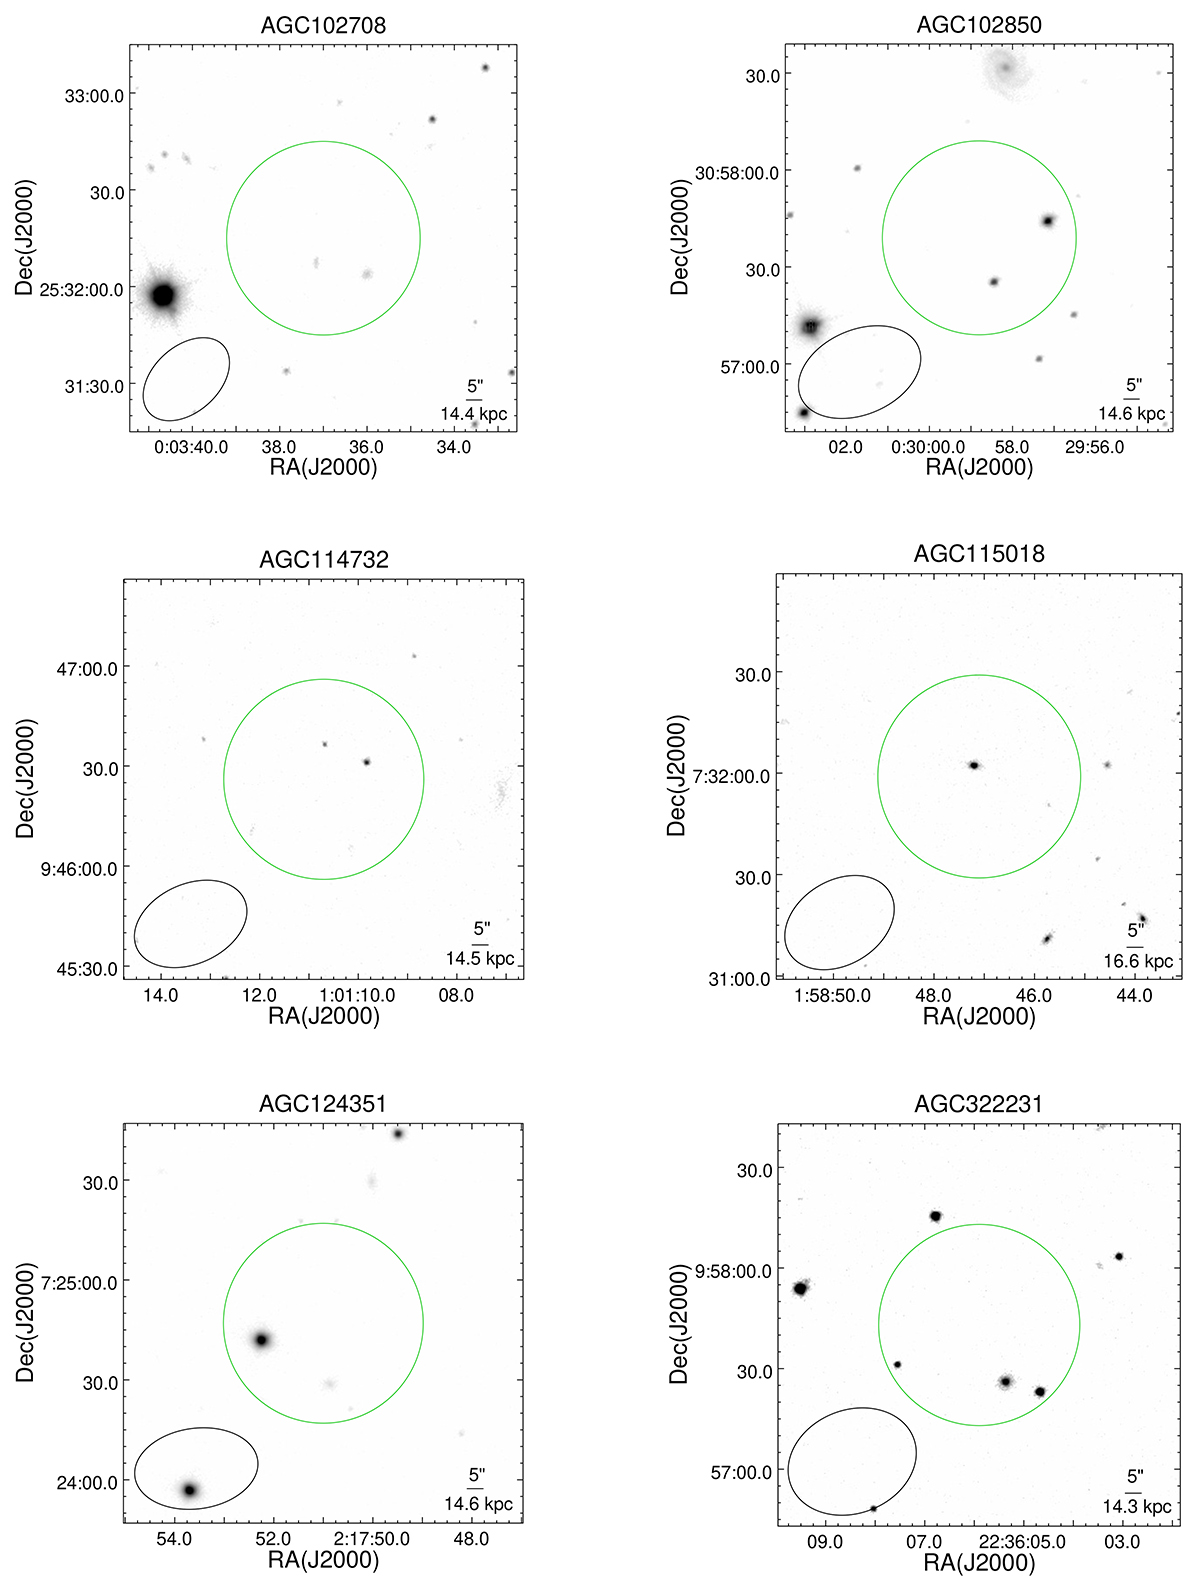
Fig. 1.
Download original image
OH line and radio continuum emission overlaid on SDSS R-band grey image. Green: circular region for generating the emission of the OH line from GMRT-central data, beam size of these sources, and parameters from Table B.1. Magenta: contour of OH line emission. The velocities range of the OH line emission: AGC 115713: 50 884.8–51 155.4 km s−1 (see Fig. 2); contour levels: 3σ (0.001 Jy beam−1) × (1 2 4 ...). For AGC 249507: 53 336.1–53 665.1 km s−1, contour levels: 3σ (0.000592 Jy beam−1) × (1 2 4 ...). Blue: L-band radio continuum emission and parameters from Table 1.
Current usage metrics show cumulative count of Article Views (full-text article views including HTML views, PDF and ePub downloads, according to the available data) and Abstracts Views on Vision4Press platform.
Data correspond to usage on the plateform after 2015. The current usage metrics is available 48-96 hours after online publication and is updated daily on week days.
Initial download of the metrics may take a while.