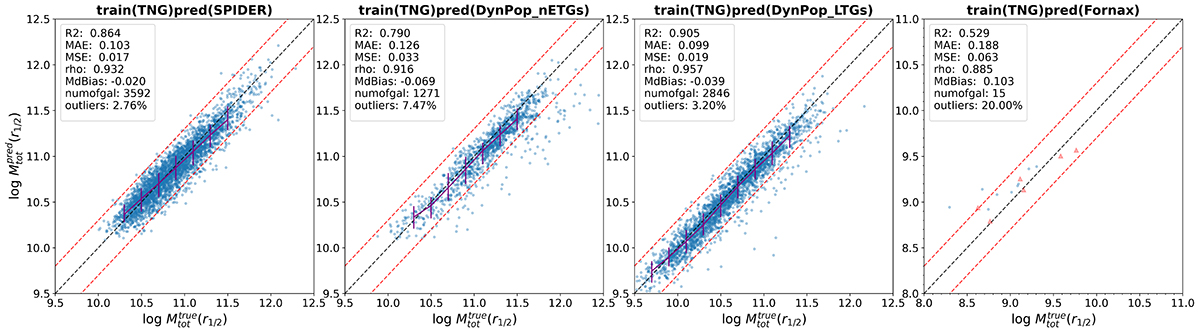
Fig. 9.
Download original image
MELA_ALL predictions of the central total mass, Mtot(r1/2), for the real galaxy dynamical samples. The optimal feature combination (i.e., r1/2, M⋆ and σ) is used, as discussed in Sect. 4.1 and Table 4. Shown (from left to right) are predictions of the SPIDER sample; the DynPop/nETG; the DynPop/LTG samples; and the DSAMI sample. The dynamical model used as representative of the MaNGA Dynpop results is the JAMsph+generalized NFW profile (see Sect. 2.3.2). For the DSAMI sample, the red triangles represent the data points from the secondary test sample (1 kpc < r1/2 < 2Rp). The legend provides an overview of the statistical estimators for the different samples.
Current usage metrics show cumulative count of Article Views (full-text article views including HTML views, PDF and ePub downloads, according to the available data) and Abstracts Views on Vision4Press platform.
Data correspond to usage on the plateform after 2015. The current usage metrics is available 48-96 hours after online publication and is updated daily on week days.
Initial download of the metrics may take a while.