Fig. A.1.
Download original image
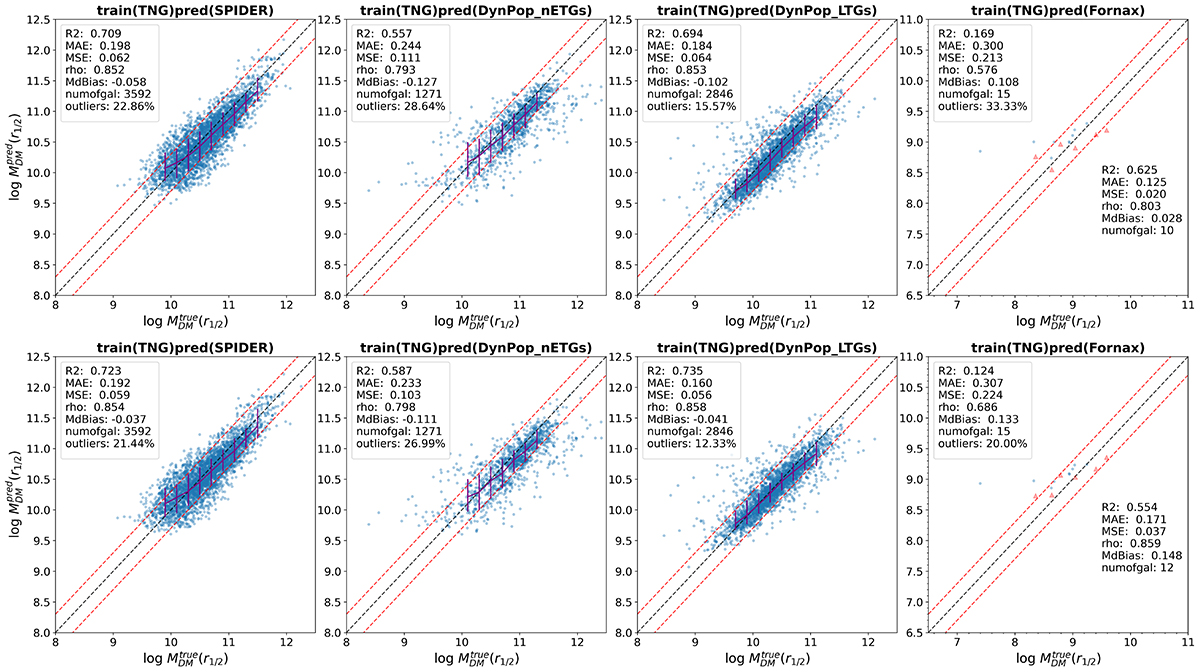
MELA_ALL predictions of the central dark matter (MDM(r1/2), top row) and augmented DM (![]() ), bottom row) for the real galaxy dynamical samples. The different definition of the target is discussed in Sect. 2.1. The optimal feature combination was used (i.e., r1/2, M⋆ and σ) as indicated in Sect. 4.1 and Table 3. As for Fig. 9, the dynamical model used in MaNGA Dynpop is JAMsph+generalized NFW profile, as mentioned in Sect. 2.3.2. For the DSAMI sample, the red triangle represents data point from the secondary test sample (1 kpc < r1/2 < 2Rp). The legend shows the statistical estimators. The bottom right corner inset of the DSAMI sample gives the estimators after excluding the outliers, as previously done in Fig. 11.
), bottom row) for the real galaxy dynamical samples. The different definition of the target is discussed in Sect. 2.1. The optimal feature combination was used (i.e., r1/2, M⋆ and σ) as indicated in Sect. 4.1 and Table 3. As for Fig. 9, the dynamical model used in MaNGA Dynpop is JAMsph+generalized NFW profile, as mentioned in Sect. 2.3.2. For the DSAMI sample, the red triangle represents data point from the secondary test sample (1 kpc < r1/2 < 2Rp). The legend shows the statistical estimators. The bottom right corner inset of the DSAMI sample gives the estimators after excluding the outliers, as previously done in Fig. 11.
Current usage metrics show cumulative count of Article Views (full-text article views including HTML views, PDF and ePub downloads, according to the available data) and Abstracts Views on Vision4Press platform.
Data correspond to usage on the plateform after 2015. The current usage metrics is available 48-96 hours after online publication and is updated daily on week days.
Initial download of the metrics may take a while.