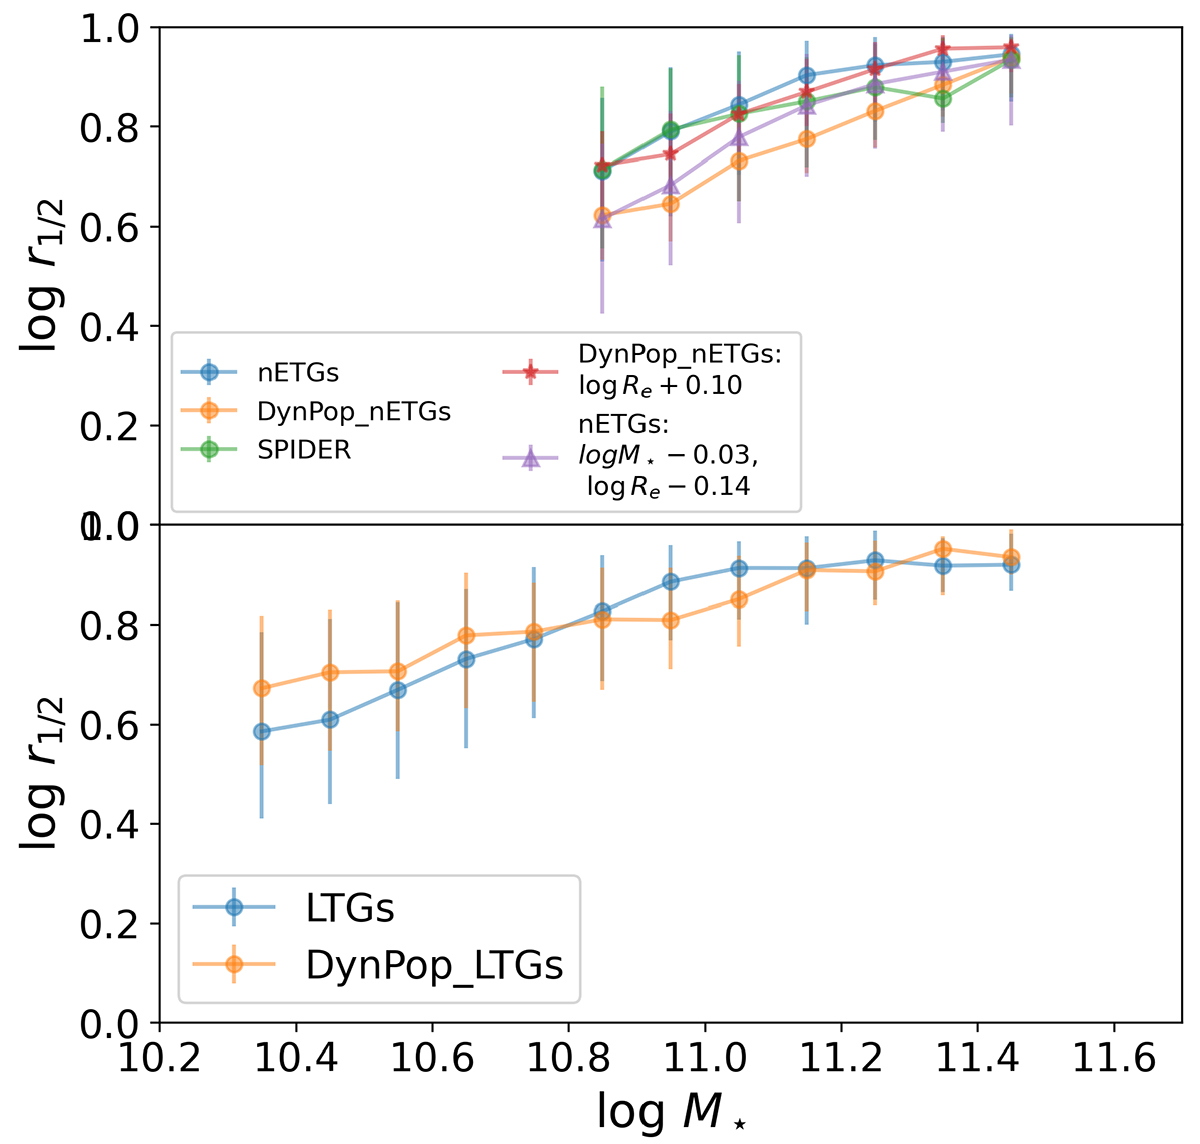
Fig. 16.
Download original image
Median mass-size relation of the TNG100 simulated galaxies and the observed datasets. Top: ETG galaxies from TNG100 (nETGs), SPIDER, and DynPop_nETGs (see inset for legend). Bottom: LTG galaxies from TNG100 and DynPop_LTGs, as in the legend. Error bars represent the 0.16, 0.84 percentiles of the data within different bins. We use log M⋆/M⊙ = 10.8, as a reasonable completeness limit based on the DynPop_nETGs and log M⋆/M⊙ = 10.3 for the LTGs samples.
Current usage metrics show cumulative count of Article Views (full-text article views including HTML views, PDF and ePub downloads, according to the available data) and Abstracts Views on Vision4Press platform.
Data correspond to usage on the plateform after 2015. The current usage metrics is available 48-96 hours after online publication and is updated daily on week days.
Initial download of the metrics may take a while.