Open Access
Fig. 11.
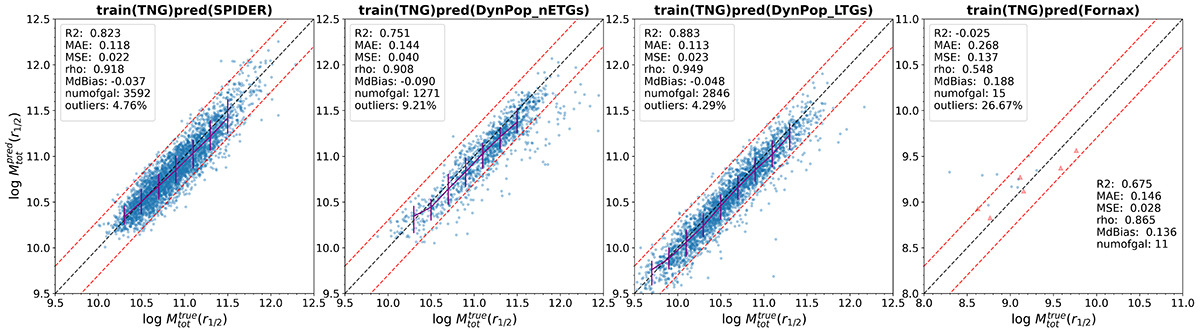
Download original image
MELA_ALL predictions of the central total mass, Mtot(r1/2), as in Fig. 9, but using only two features: r1/2 and M⋆. In the case of DSAMI, there are three obvious outliers above +0.30 dex. In the bottom right corner of the plot are shown the statistical estimators obtained excluding these outliers.
Current usage metrics show cumulative count of Article Views (full-text article views including HTML views, PDF and ePub downloads, according to the available data) and Abstracts Views on Vision4Press platform.
Data correspond to usage on the plateform after 2015. The current usage metrics is available 48-96 hours after online publication and is updated daily on week days.
Initial download of the metrics may take a while.