Fig. 7.
Download original image
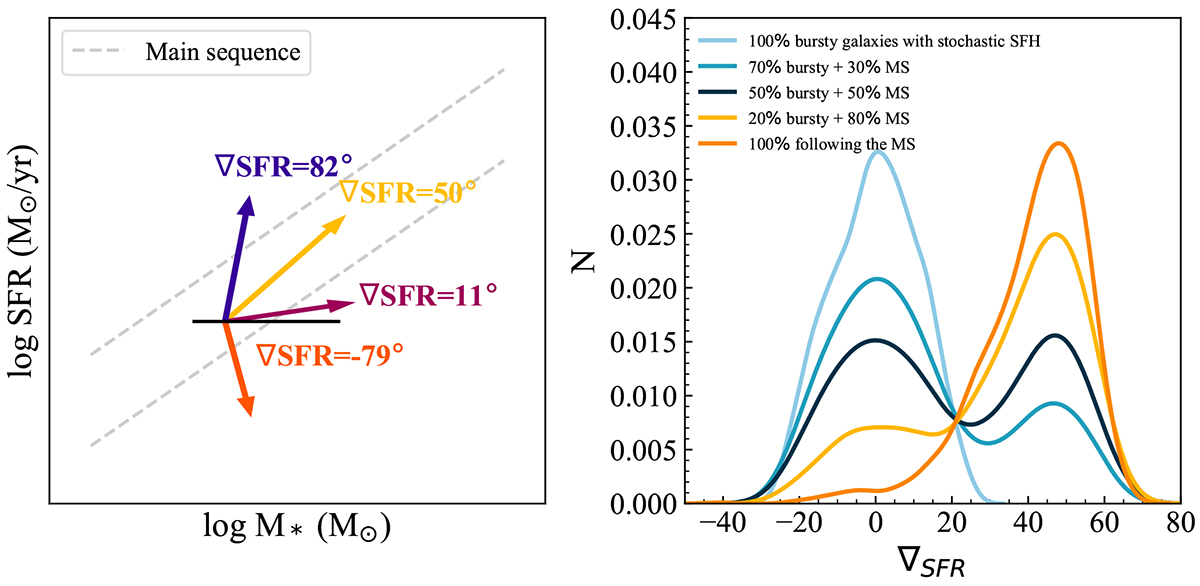
Interpretation of the SFR gradient. Left panel: schematic example of the definition of ∇SFR. The gradient corresponding to each arrow is indicated in the same colour and shows the path that the galaxies followed recently. The point of the arrow indicates the position of the galaxy when observed. The black line is the reference from which the angle of the gradient is computed. The grey dashed lines give the position of the MS with its dispersion. Right panel: mock distributions of ∇SFR obtained from simple modelling.
Current usage metrics show cumulative count of Article Views (full-text article views including HTML views, PDF and ePub downloads, according to the available data) and Abstracts Views on Vision4Press platform.
Data correspond to usage on the plateform after 2015. The current usage metrics is available 48-96 hours after online publication and is updated daily on week days.
Initial download of the metrics may take a while.