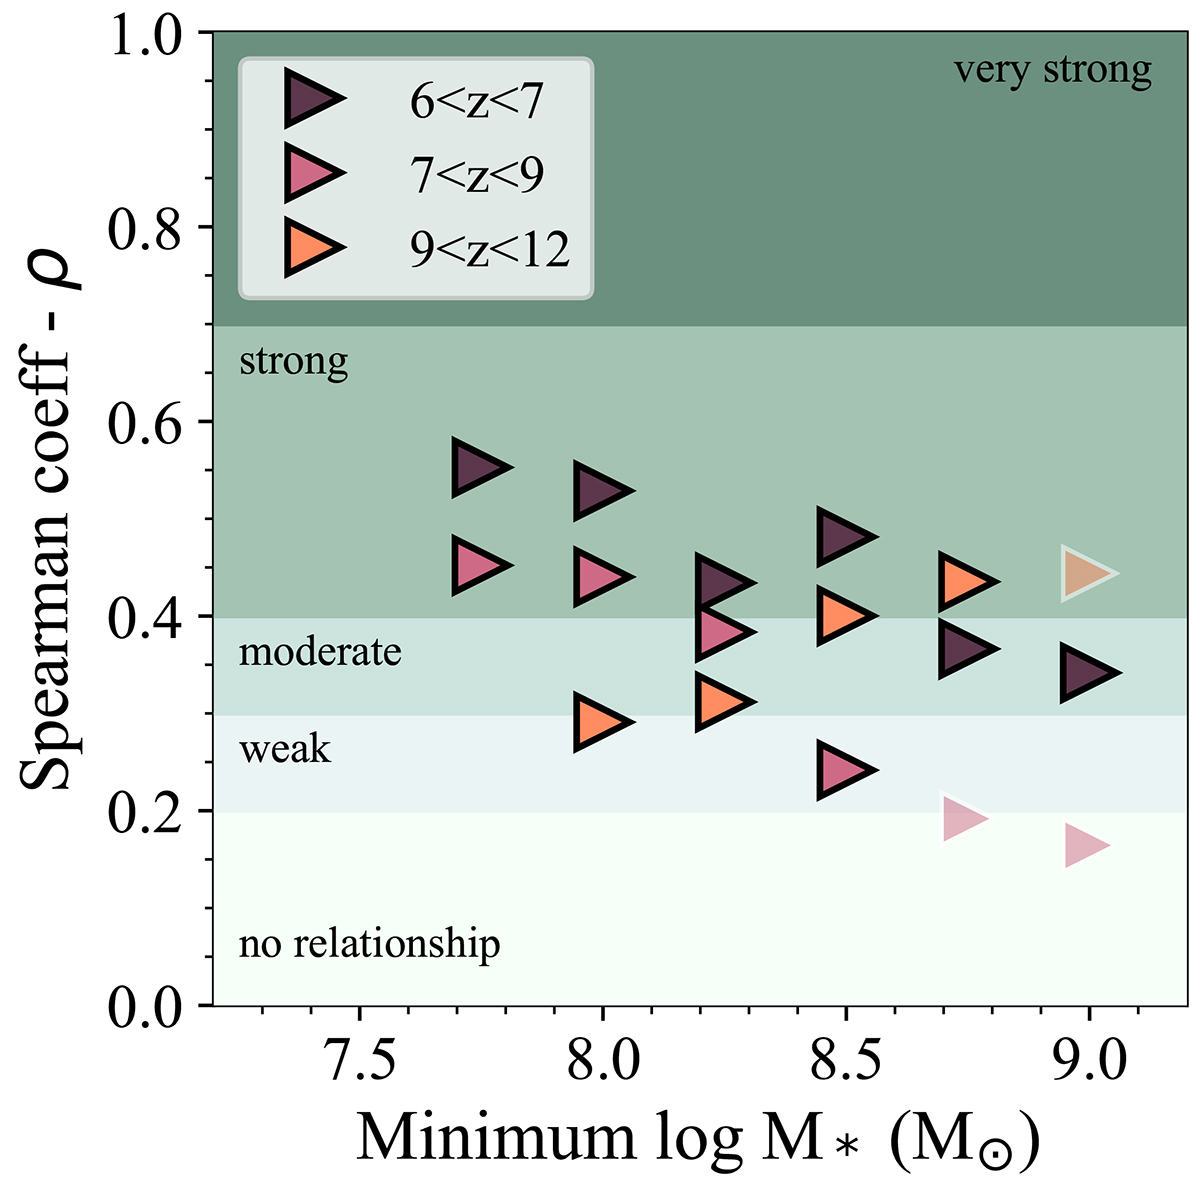
Fig. 5.
Download original image
Spearman coefficient of the SFR vs stellar mass as a function of the minimum stellar mass used to compute it. The symbol colours indicate the redshift range of the galaxies considered. Those with black contours are considered reliable coefficient values since they are associated with p-values lower than 0.05. The green shaded regions indicate the interpretation scale.
Current usage metrics show cumulative count of Article Views (full-text article views including HTML views, PDF and ePub downloads, according to the available data) and Abstracts Views on Vision4Press platform.
Data correspond to usage on the plateform after 2015. The current usage metrics is available 48-96 hours after online publication and is updated daily on week days.
Initial download of the metrics may take a while.