Open Access
Fig. 2
Download original image
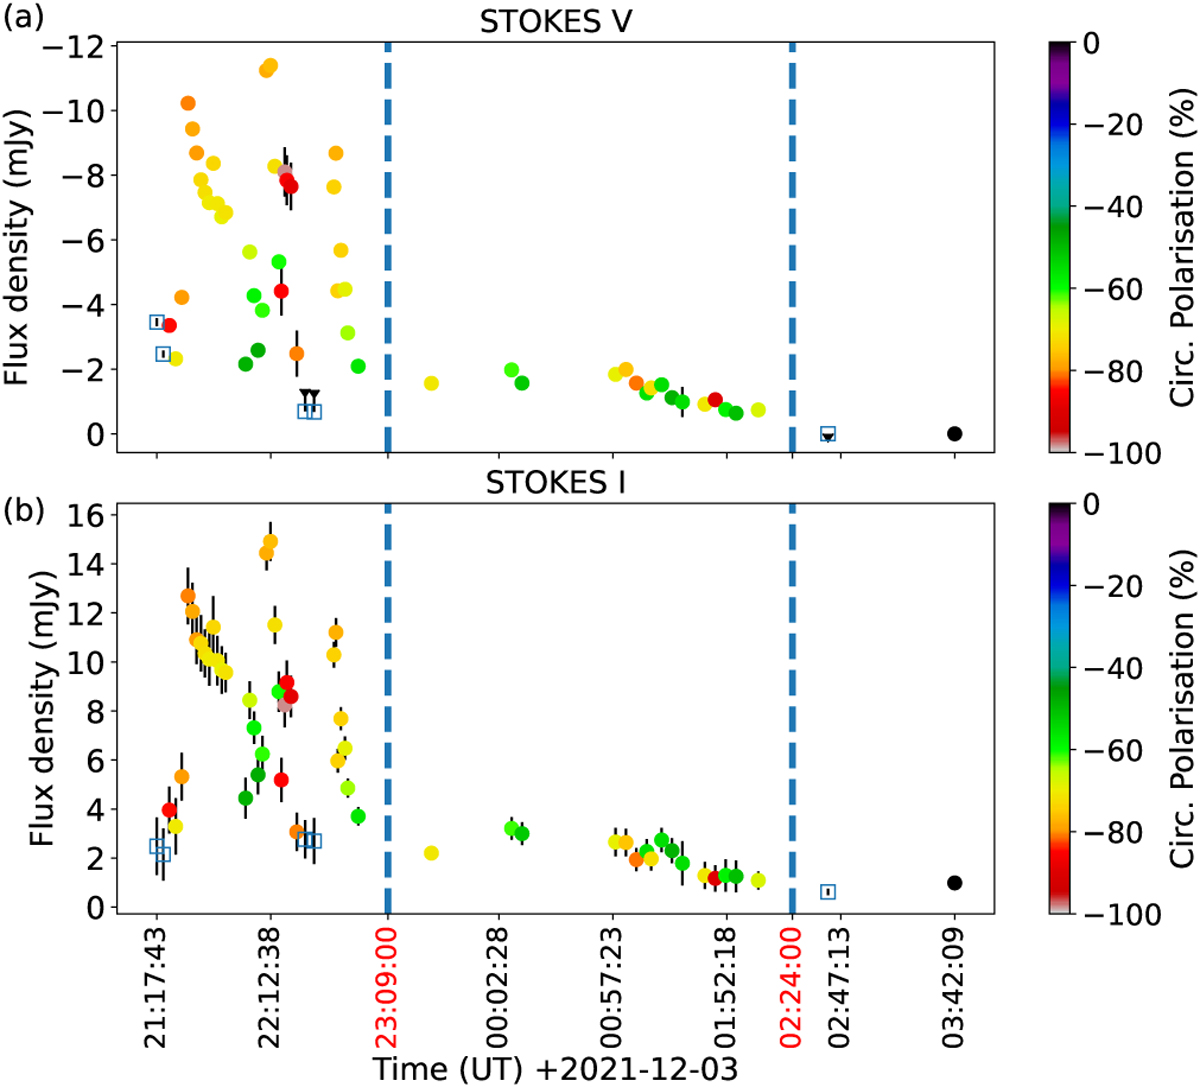
Band-averaged Stokes I and V light curves obtained from imaging analysis. The detections below 5σ are marked as upper limits. Transparent squares mark poor polarisation estimates.
Current usage metrics show cumulative count of Article Views (full-text article views including HTML views, PDF and ePub downloads, according to the available data) and Abstracts Views on Vision4Press platform.
Data correspond to usage on the plateform after 2015. The current usage metrics is available 48-96 hours after online publication and is updated daily on week days.
Initial download of the metrics may take a while.