Fig. 1
Download original image
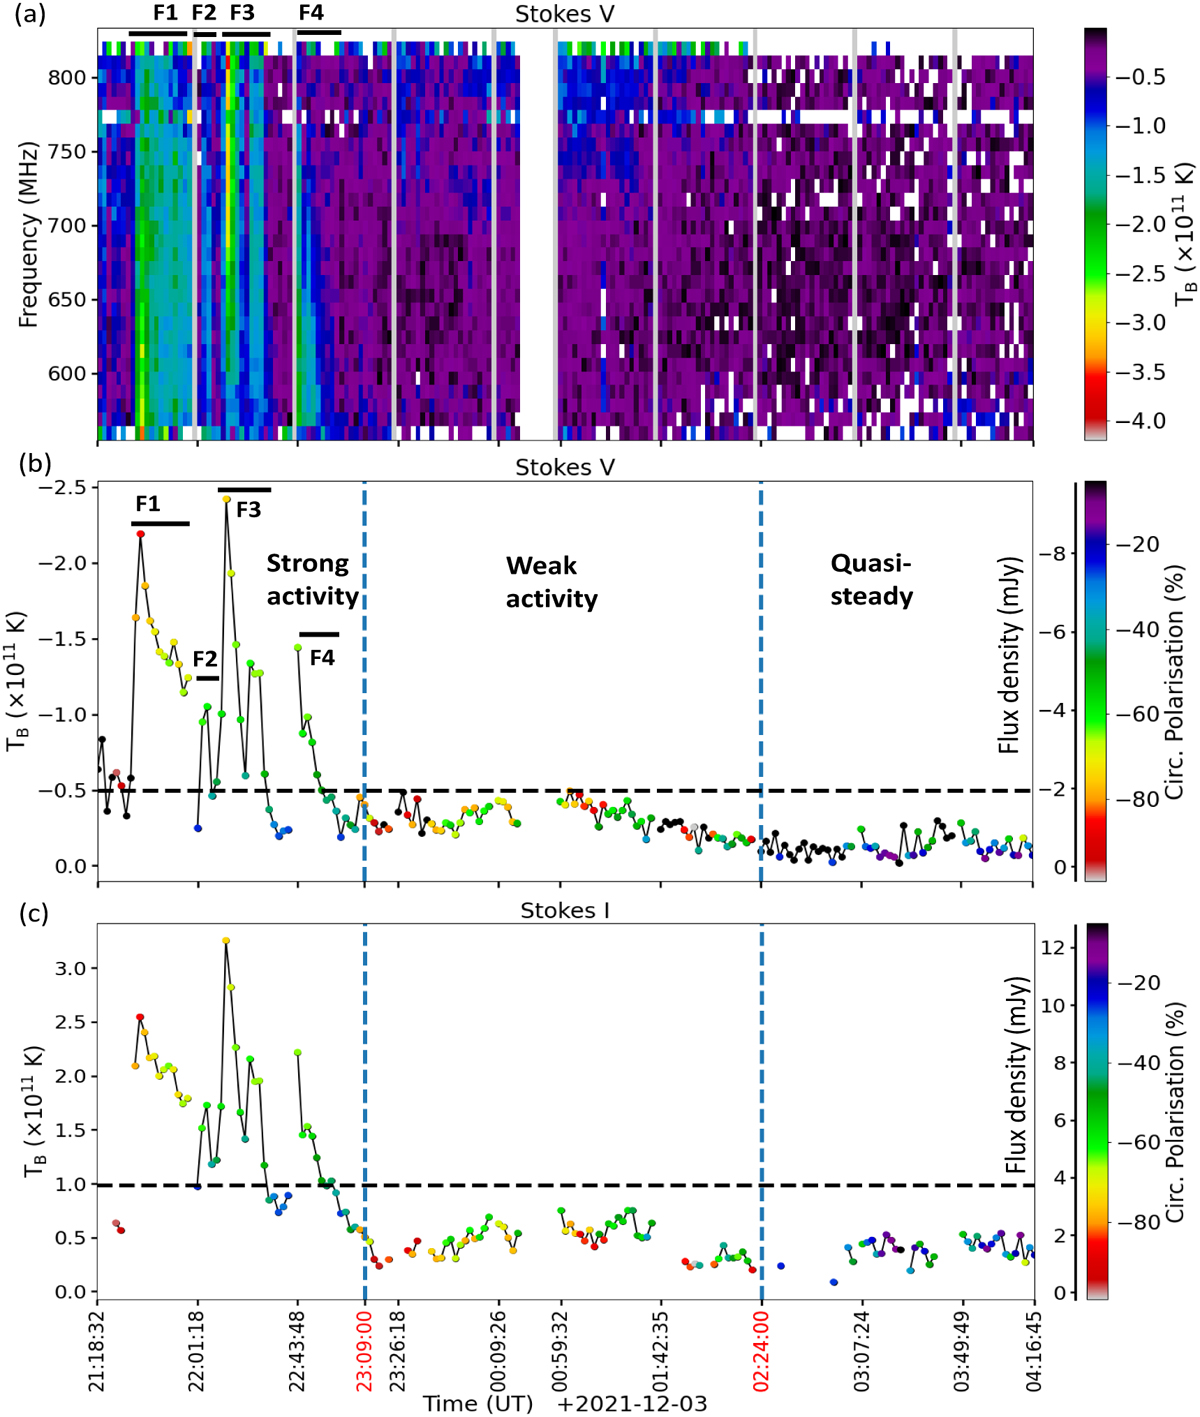
Results from VISAD pipeline. (a) Stokes V dynamic spectrum. (b, c) Band-averaged light curves in Stokes V and I. The ordinate shows TB (left) and flux density (right), respectively. Different periods of activity are marked. Basal flux density levels in Stokes I and V are represented by dotted lines in the respective panels. We note that the TB values are nominal and simply highlight that the emission is via a coherent emission mechanism. Since the true source sizes are unknown, an average (i.e. across the whole unresolved stellar disc) TB is computed here.
Current usage metrics show cumulative count of Article Views (full-text article views including HTML views, PDF and ePub downloads, according to the available data) and Abstracts Views on Vision4Press platform.
Data correspond to usage on the plateform after 2015. The current usage metrics is available 48-96 hours after online publication and is updated daily on week days.
Initial download of the metrics may take a while.