Fig. 7.
Download original image
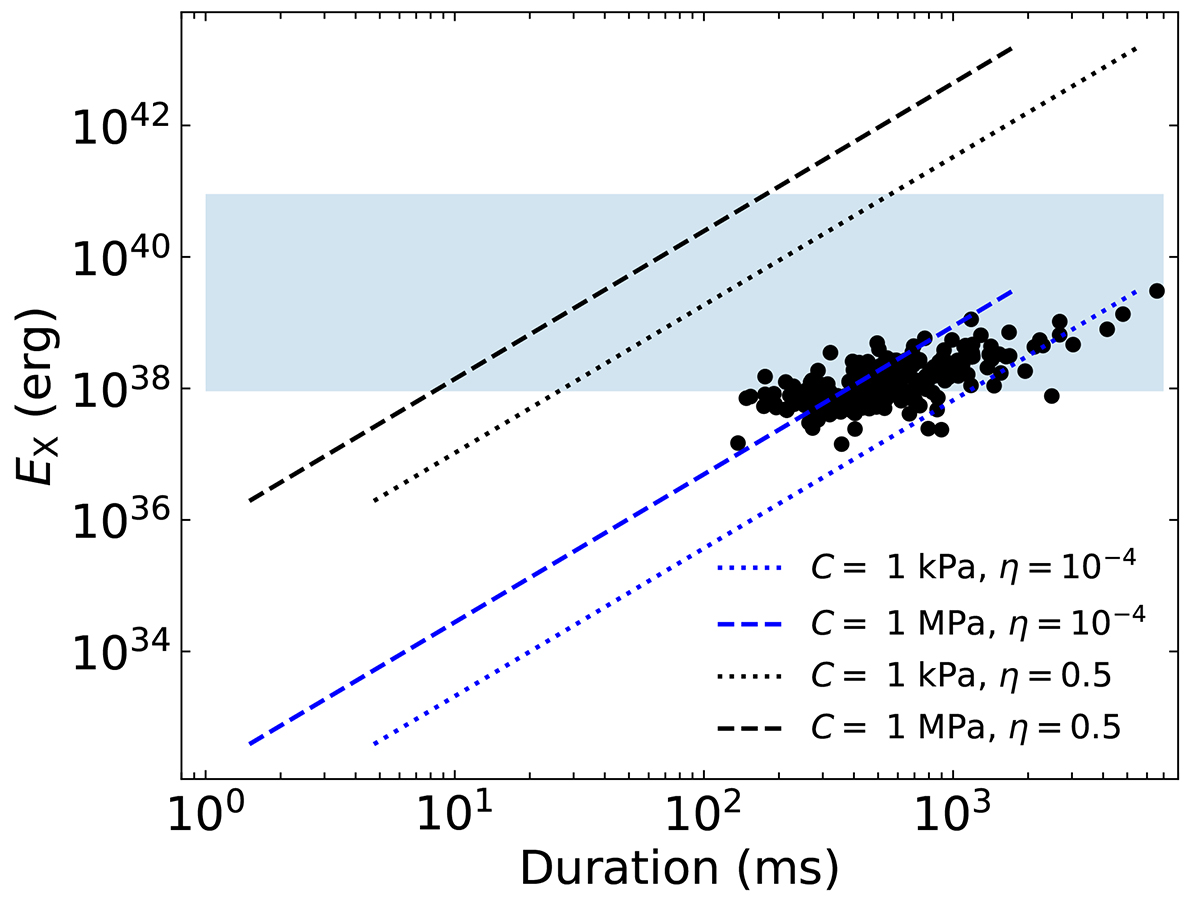
X-ray bursts from SGR 1806-20 plotted on the energy-duration plane. The black dots denote the observational data (Kırmızıbayrak et al. 2017). The lines are the theoretical results calculated by taking different values for the cohesive strength (C) and energy transforming efficiency (η). The shaded area represents the energy range of the bursts detected by the ICE detector (Göǧüş et al. 2000).
Current usage metrics show cumulative count of Article Views (full-text article views including HTML views, PDF and ePub downloads, according to the available data) and Abstracts Views on Vision4Press platform.
Data correspond to usage on the plateform after 2015. The current usage metrics is available 48-96 hours after online publication and is updated daily on week days.
Initial download of the metrics may take a while.