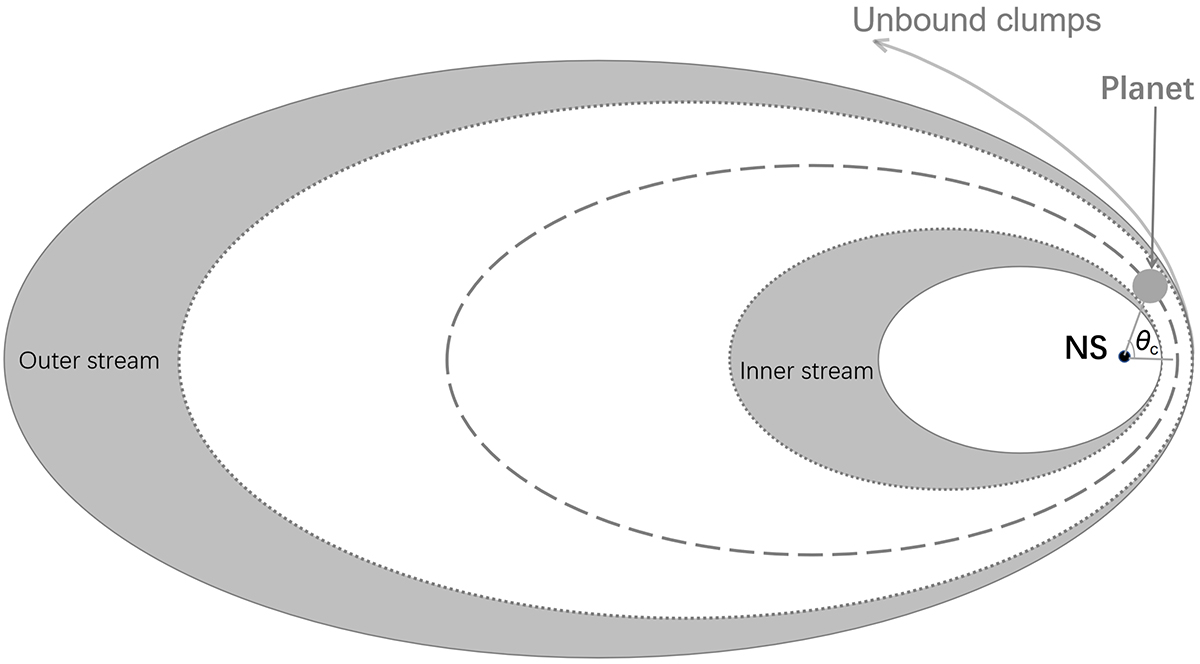
Fig. 1.
Download original image
Schematic illustration (not to scale) of the partial disruption of a planet around a NS. The dashed ellipse represents the orbit of the planet. The gray areas represent possible ranges of the clumps’ orbit in the inner and outer bound stream. The dotted ellipses at the fringe of these gray areas represent the orbits of the clumps generated near θ = θc. The solid ellipse in the inner stream represents the clumps produced near θ = 0, while the solid ellipse in the outer stream represents the clumps produced at somewhere between θ = 0 and θ = θc, depending on the structure of the planet. The curved arrow represents unbound clumps.
Current usage metrics show cumulative count of Article Views (full-text article views including HTML views, PDF and ePub downloads, according to the available data) and Abstracts Views on Vision4Press platform.
Data correspond to usage on the plateform after 2015. The current usage metrics is available 48-96 hours after online publication and is updated daily on week days.
Initial download of the metrics may take a while.