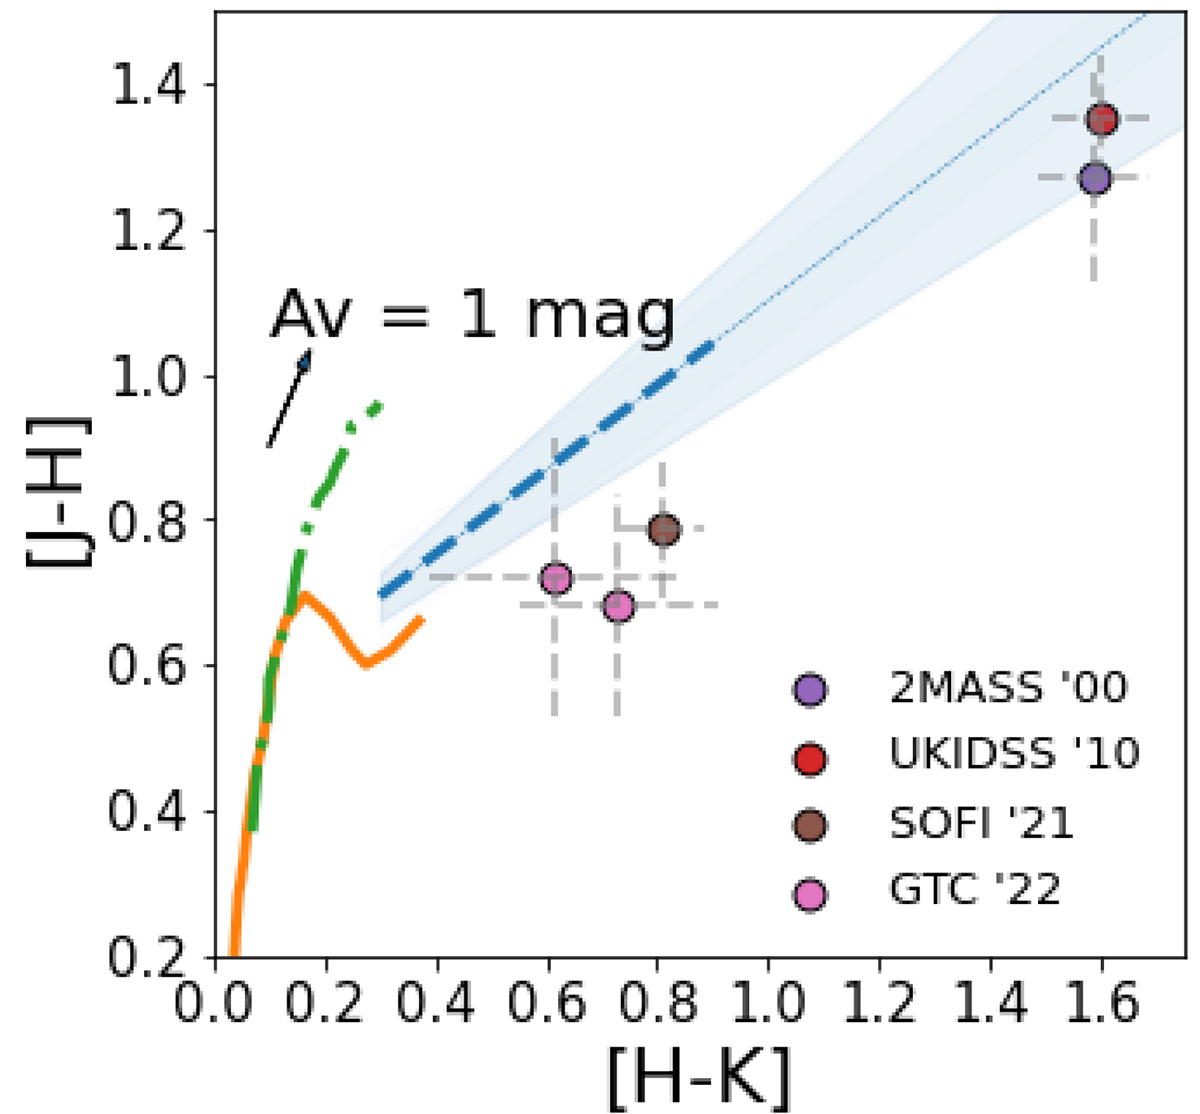
Fig. 4.
Download original image
NIR color-color diagram of Gaia18cjb. Purple and red circles are pre-outburst data from 2MASS and UKIDSS observations in 2000 and 2010, respectively, while the brown and pink dots correspond to SOFI and GTC photometry in the burst phase (2021 and 2022, respectively). The blue dashed line and light blue region represent the CTTS locus and its uncertainty (Meyer et al. 1997), and the tiny blue dotted line its extension toward larger color indices. The orange solid and green dotted-dashed lines correspond to the colors of ZAMS and GB stars, respectively. The black arrow shows the reddening vector for a source with 1 mag of extinction (Cardelli et al. 1989, RV = 3.1).
Current usage metrics show cumulative count of Article Views (full-text article views including HTML views, PDF and ePub downloads, according to the available data) and Abstracts Views on Vision4Press platform.
Data correspond to usage on the plateform after 2015. The current usage metrics is available 48-96 hours after online publication and is updated daily on week days.
Initial download of the metrics may take a while.