Open Access
Fig. 2.
Download original image
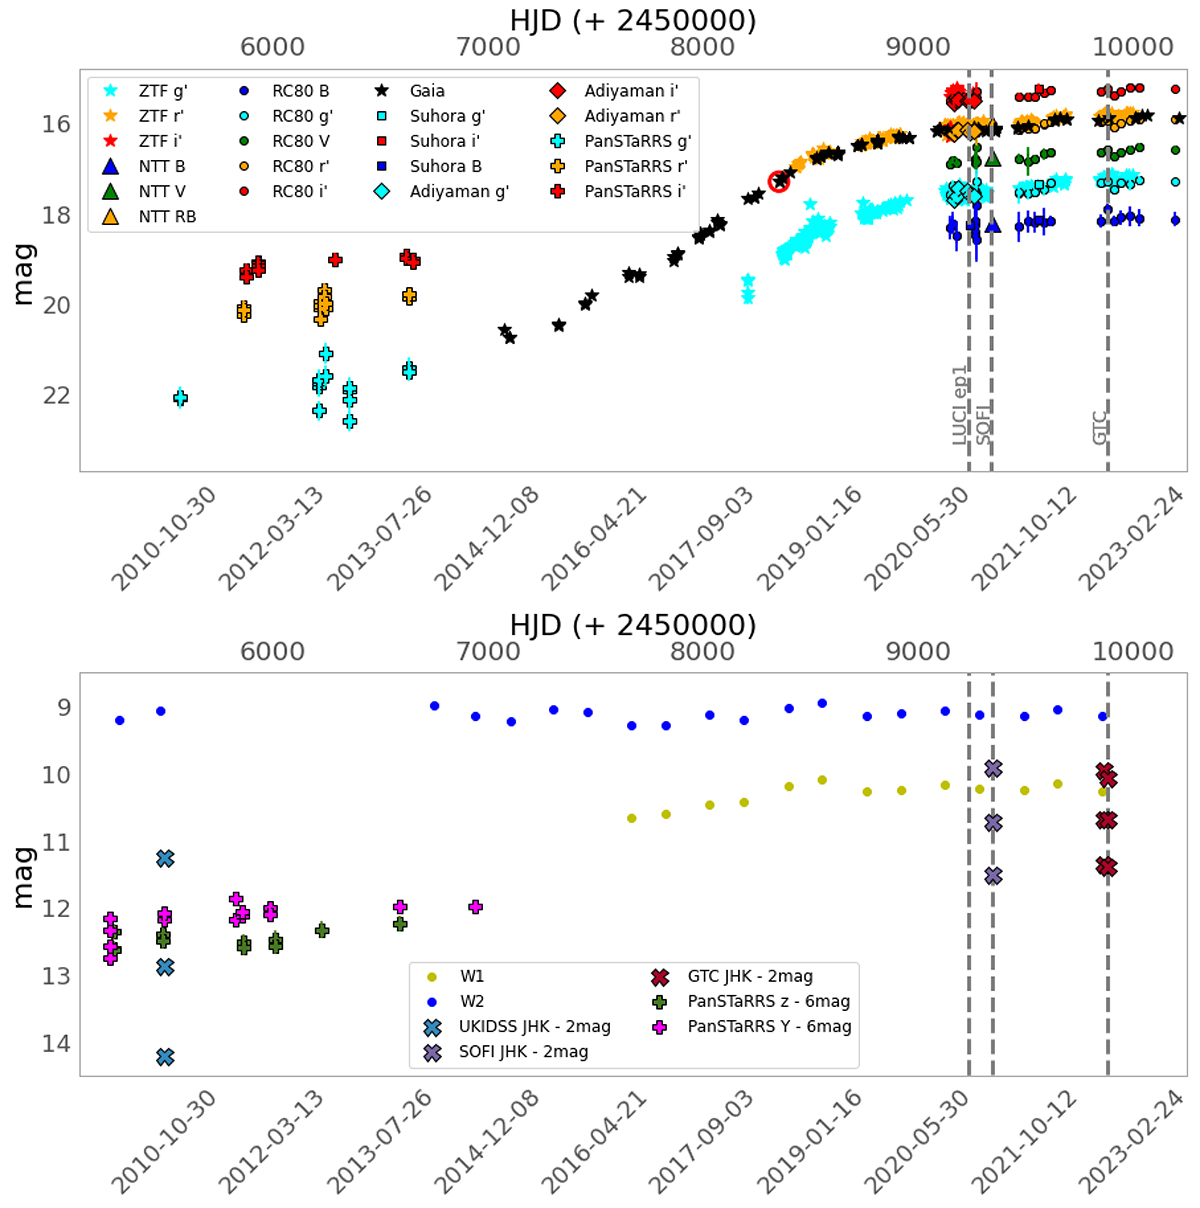
Visible (top) and IR (bottom) light curves of Gaia18cjb. The red circle highlights the Gaia Alert trigger. The error bars smaller than the symbol size are not presented. Grey dashed lines correspond to the epochs for which we collected NIR spectroscopy.
Current usage metrics show cumulative count of Article Views (full-text article views including HTML views, PDF and ePub downloads, according to the available data) and Abstracts Views on Vision4Press platform.
Data correspond to usage on the plateform after 2015. The current usage metrics is available 48-96 hours after online publication and is updated daily on week days.
Initial download of the metrics may take a while.