Fig. 12.
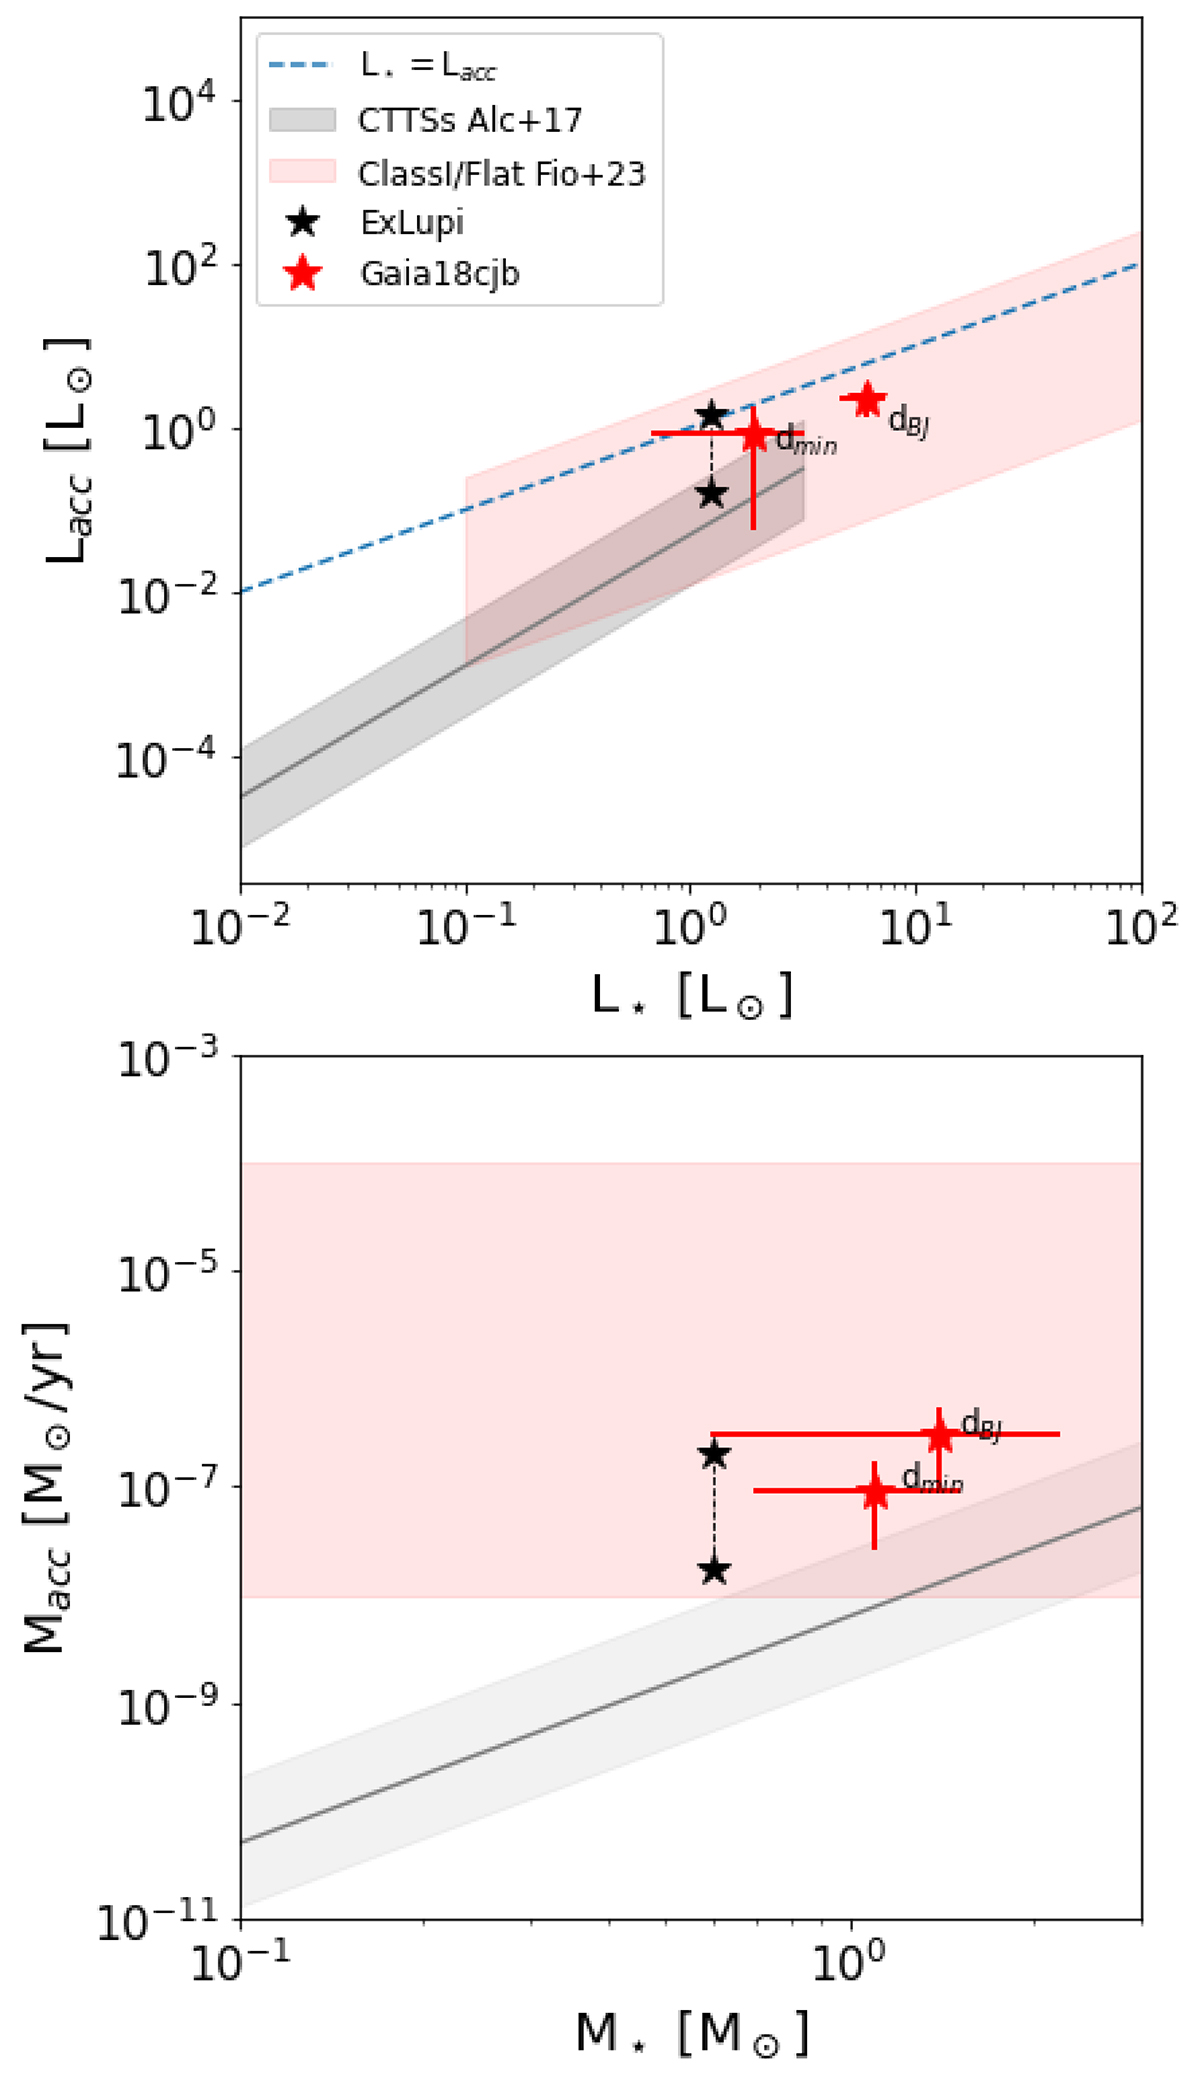
Download original image
Accretion parameters as a function of the stellar parameters. Top:Lacc − L⋆ diagram. The red and black star symbols correspond to Gaia18cjb and EX Lup, respectively. The blue dashed line represents the Lacc = L⋆ locus. The grey line is the best fit for the CTTSs of Lupus from Alcalá et al. (2017) and the grey region corresponds to the standard deviation of the t. Bottom: Ṁacc − M⋆ diagram. Star symbols are as in the top panel. The grey line is the best fit for the CTTSs of Lupus from Alcalá et al. (2017) and the grey region corresponds to the standard deviation of the t. The pink area corresponds to Ṁacc ranges for embedded Class I+flat spectrum YSOs from Fiorellino et al. (2023).
Current usage metrics show cumulative count of Article Views (full-text article views including HTML views, PDF and ePub downloads, according to the available data) and Abstracts Views on Vision4Press platform.
Data correspond to usage on the plateform after 2015. The current usage metrics is available 48-96 hours after online publication and is updated daily on week days.
Initial download of the metrics may take a while.