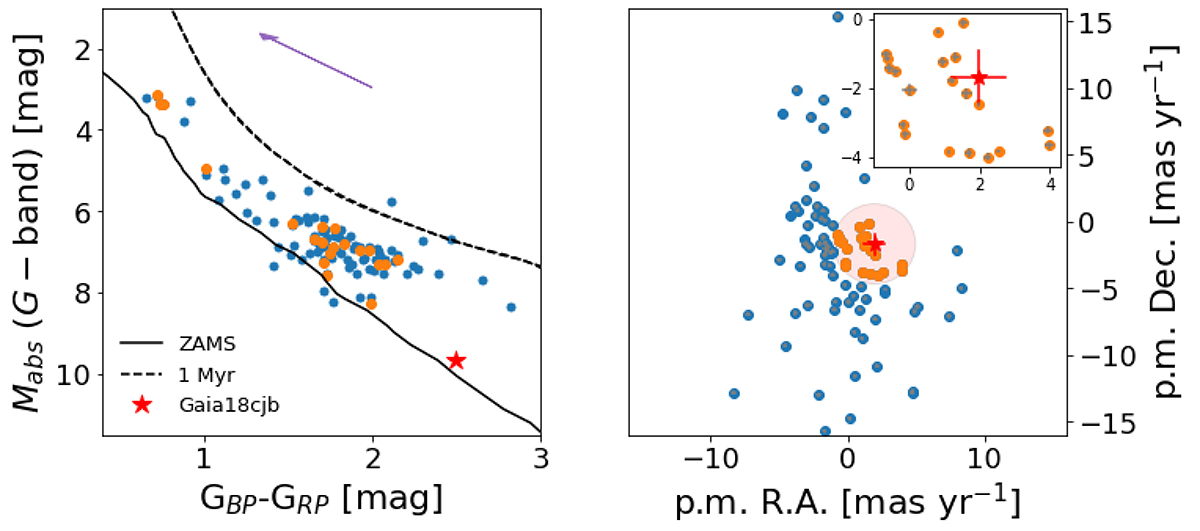
Fig. 11.
Download original image
Analysis on the young stellar nature of Gaia18cjb. Left: color-absolute magnitude diagram not corrected for the extinction. The red star symbol corresponds to Gaia18cjb. The black solid and dashed lines show the ZAMS and the 1 Myr isochrone, respectively (Dell’Omodarme & Valle 2013). Dots are sources which show Hα-excess from Fratta et al. (2021) catalog whose distance is 0.95 kpc < d < 1.05 kpc. Orange dots are sources with proper motions consistent within 3σ the propoer motion of Gaia18cjb (see right panel). The error bars smaller than the symbol size are not presented. The purple arrow represents an extinction vector of 1 mag. However, the AV vector depends on the color index and on the position in the diagram; see Prisinzano et al. (2022). Right: proper motions diagram of the Hα-excess sample. Symbols are the same as in the left panel.
Current usage metrics show cumulative count of Article Views (full-text article views including HTML views, PDF and ePub downloads, according to the available data) and Abstracts Views on Vision4Press platform.
Data correspond to usage on the plateform after 2015. The current usage metrics is available 48-96 hours after online publication and is updated daily on week days.
Initial download of the metrics may take a while.