Fig. 10.
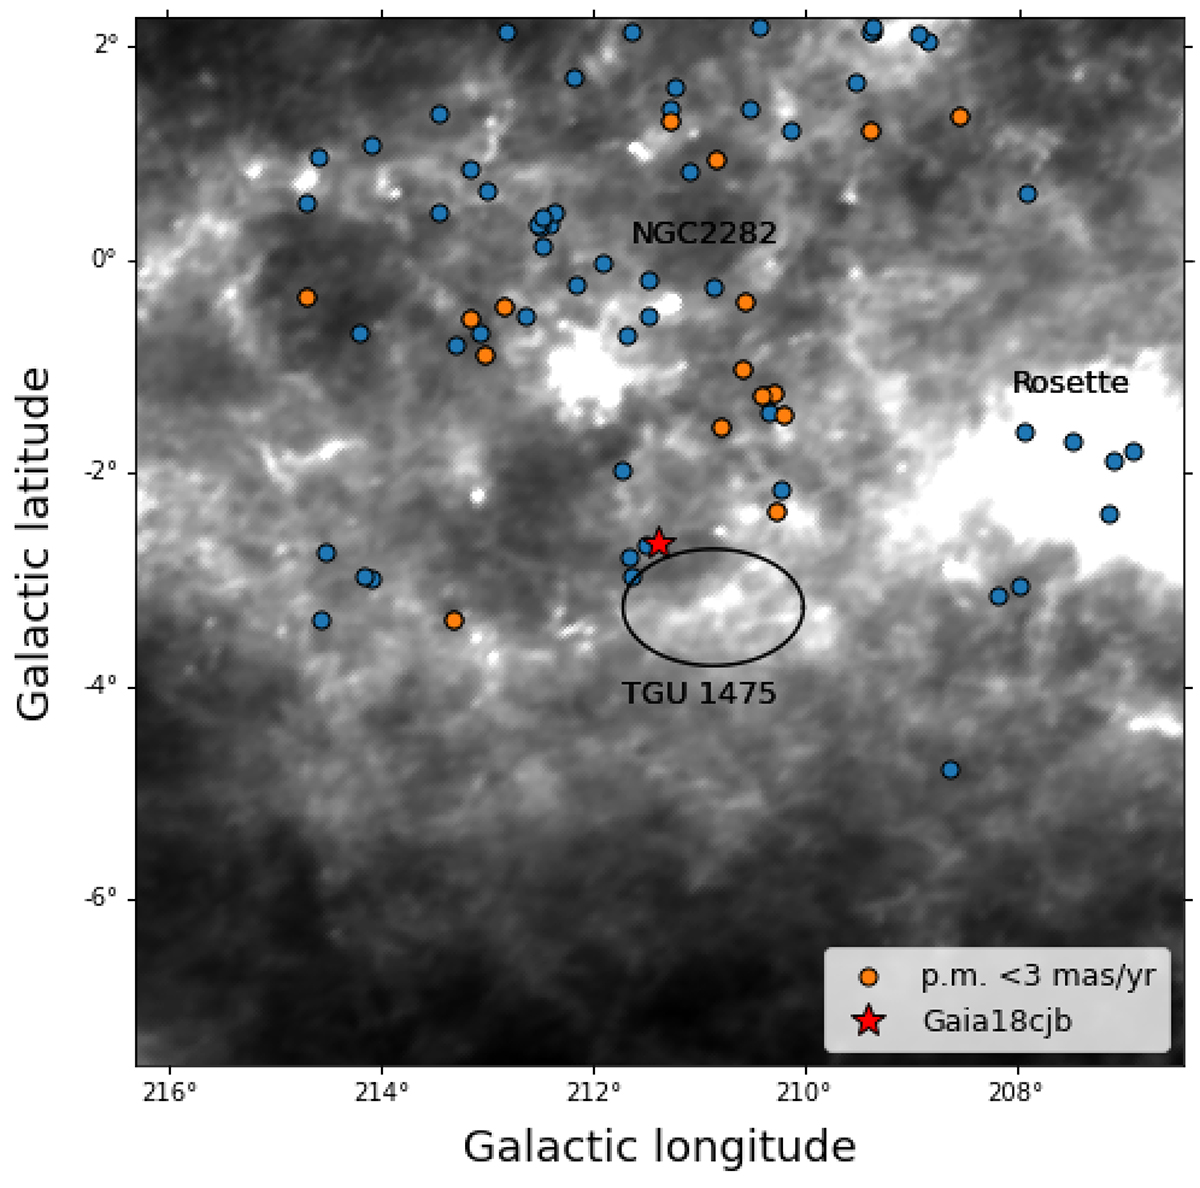
Download original image
Background of the figure is the Planck 857 GHz map, 10 degrees in size, centred on Gaia18cjb, the red star symbol in the plot. Blue and orange dots are sources with Hα-excess from Fratta et al. (2021) whose distances are 0.95 pc < d < 1.05 pc. The orange dots are sources whose proper motions are within 3 mas yr−1 from Gaia18cjb proper motions (see Fig. 11). The regions closes to Gaia18cjb are highlighted.
Current usage metrics show cumulative count of Article Views (full-text article views including HTML views, PDF and ePub downloads, according to the available data) and Abstracts Views on Vision4Press platform.
Data correspond to usage on the plateform after 2015. The current usage metrics is available 48-96 hours after online publication and is updated daily on week days.
Initial download of the metrics may take a while.