Open Access
Fig. 6
Download original image
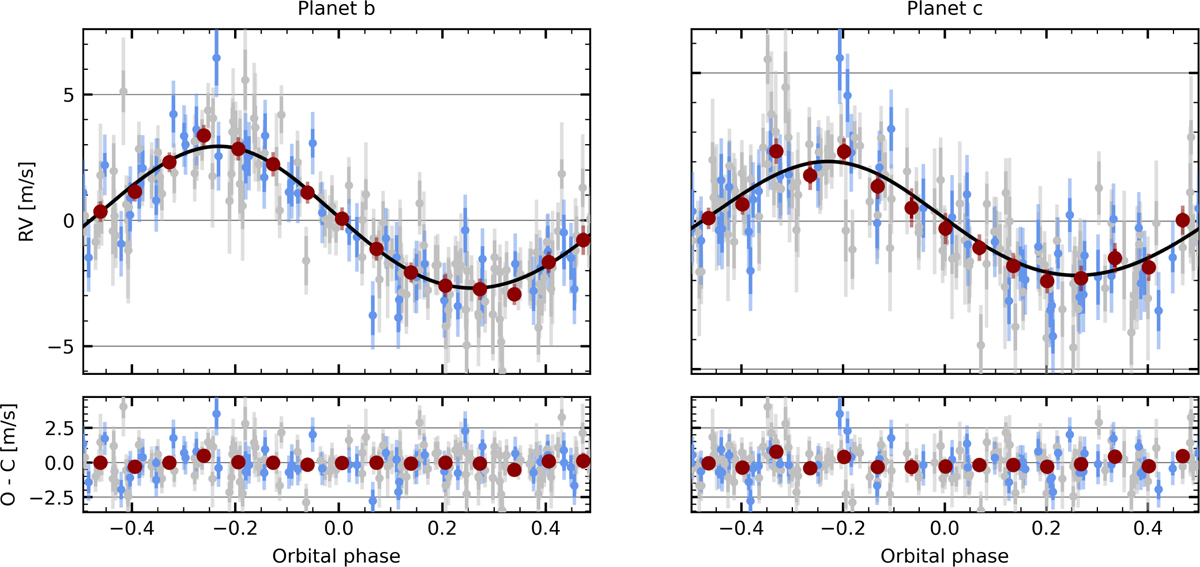
Phase-folded radial velocity curves (top) from HARPS (grey dots) and PFS (blue dots) measurements. The best-fit model of the Keplerian signal is plotted in black for HD 15337 b (left) and HD 15337 c (right). The bottom panel shows the residuals of the best-fit model as in Fig. 4. We over-plot the binned data and residuals.
Current usage metrics show cumulative count of Article Views (full-text article views including HTML views, PDF and ePub downloads, according to the available data) and Abstracts Views on Vision4Press platform.
Data correspond to usage on the plateform after 2015. The current usage metrics is available 48-96 hours after online publication and is updated daily on week days.
Initial download of the metrics may take a while.