Fig. 3
Download original image
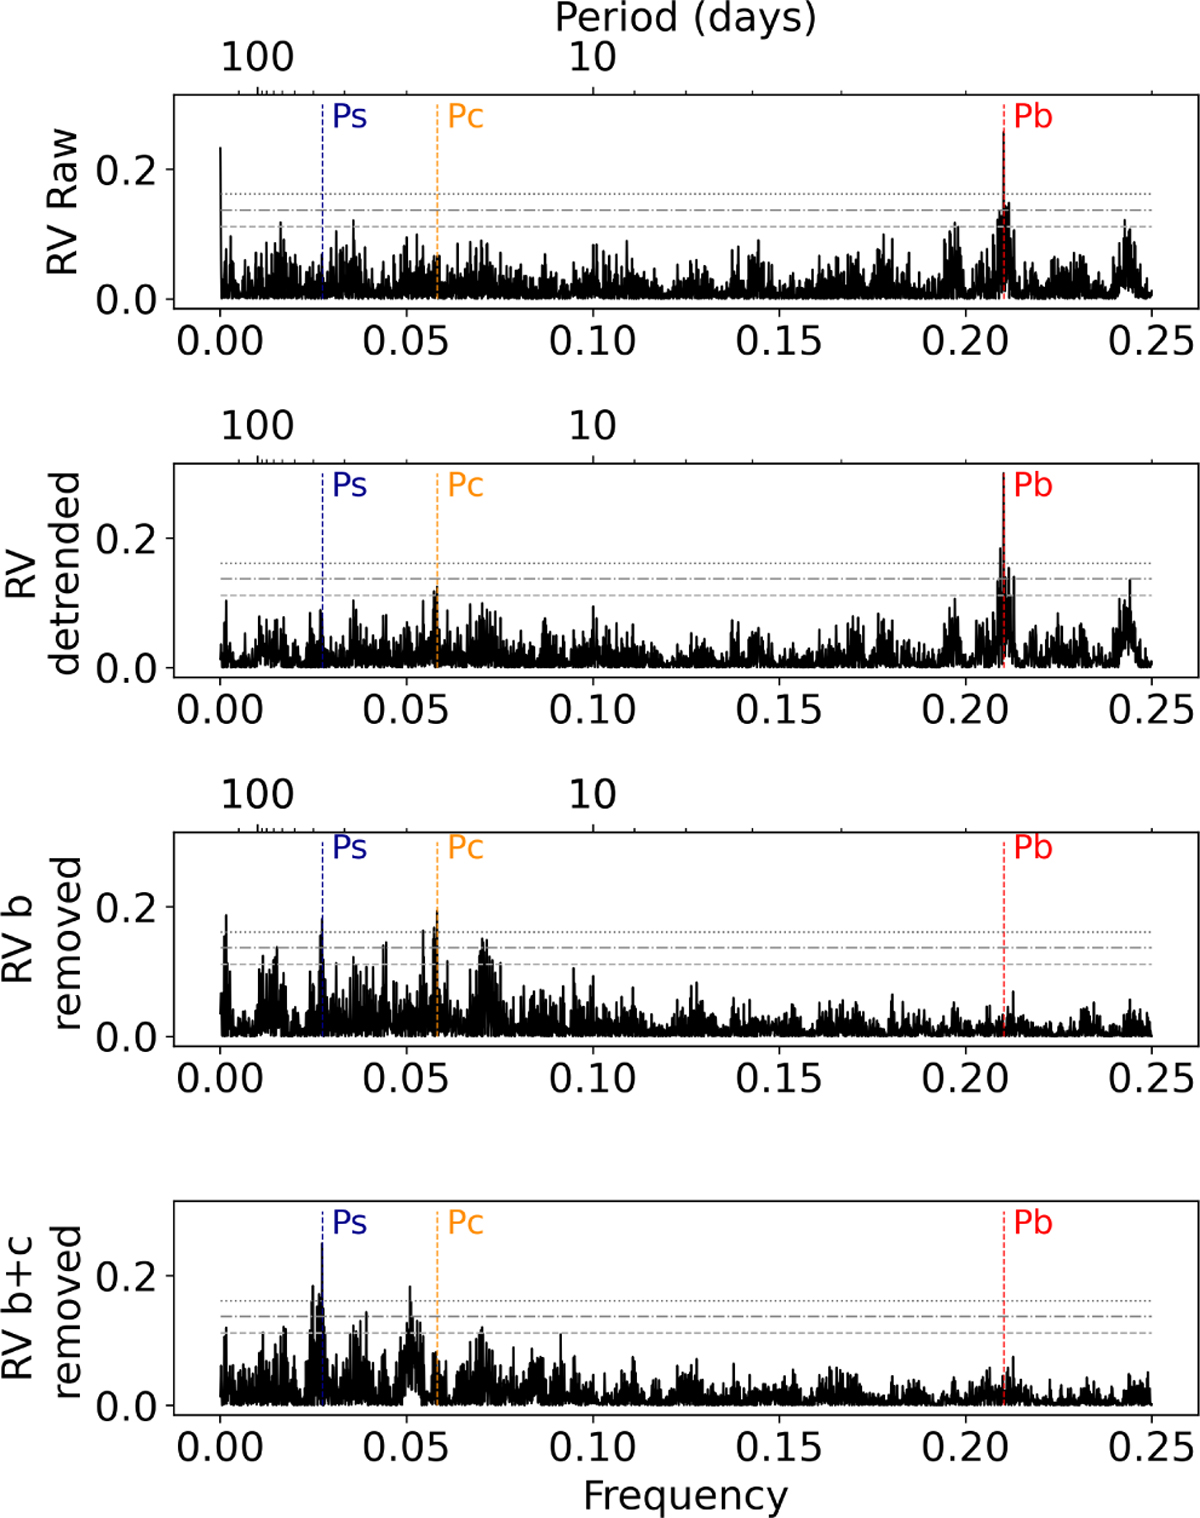
GLS periodograms, computed from the offset-corrected values. The upper panel shows the raw periodogram of the RVs as shown in Fig. 2. The second panel shows the periodogram after the removal of the long-term trends (removed with a simple second-degree polynomial regression for pre-whitening purposes only). The lower panels show the periodograms after the removal of the Keplerian signals of HD 15337 b and c from the previous one. Vertical and horizontal lines as Fig. 2.
Current usage metrics show cumulative count of Article Views (full-text article views including HTML views, PDF and ePub downloads, according to the available data) and Abstracts Views on Vision4Press platform.
Data correspond to usage on the plateform after 2015. The current usage metrics is available 48-96 hours after online publication and is updated daily on week days.
Initial download of the metrics may take a while.