Fig. 2
Download original image
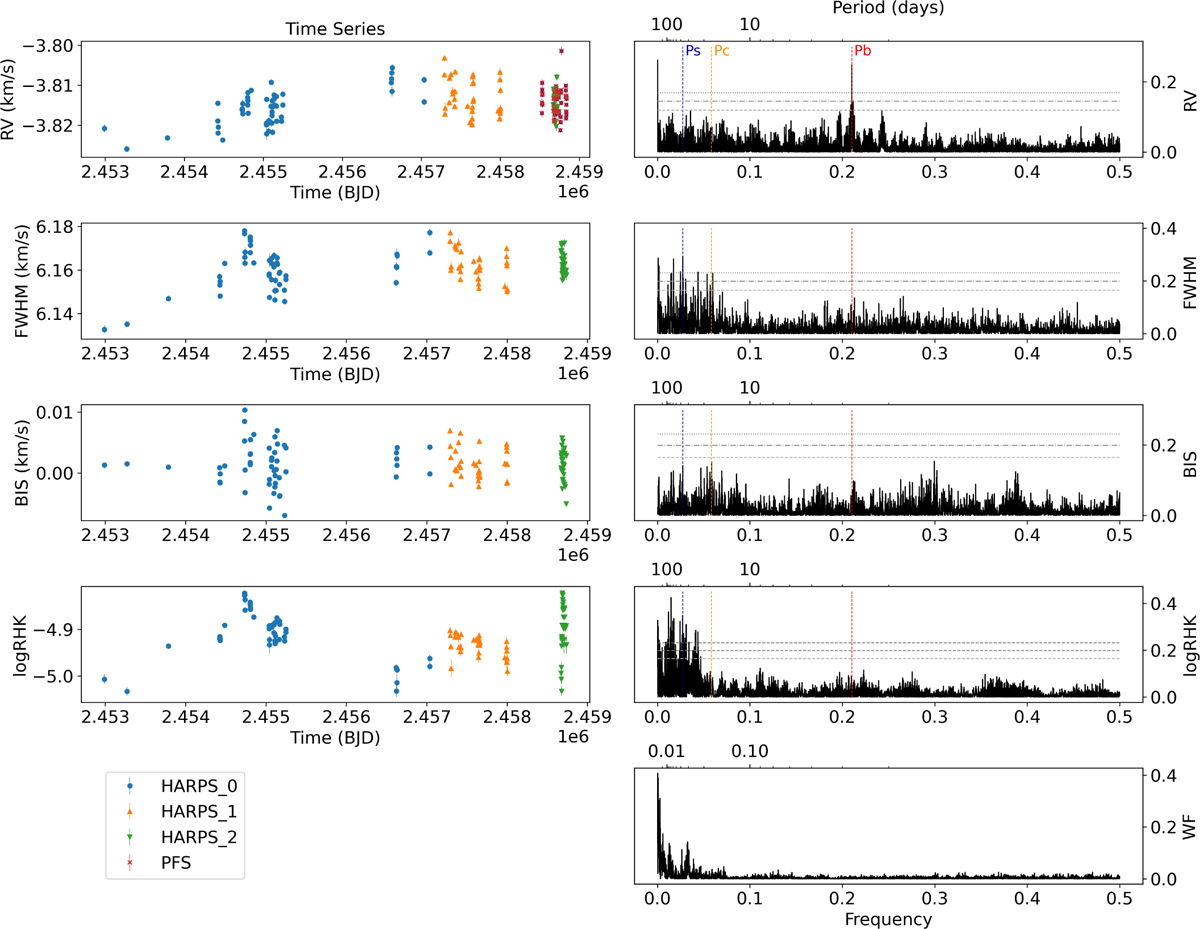
Offset-corrected time series of the RV observations of HARPS and PFS (left), as well as the activity indicators of the HARPS RVs. For a preliminary analysis and plotting purposes, the offset between the different RV sets was estimated as the median of each time series. Corresponding GLS periodograms, computed from the offset-corrected values, as the offsets induce additional non-physical peaks that can potentially mask other relevant peaks (right). The window function is plotted in the last row. The vertical dashed lines show the approximate periods of the known planets as well as the expected stellar rotation period. The dashed horizontal lines show the 10% (dashed line), 1% (dot-dashed line), and 0.1% (dotted line) false-alarm probabilities as per Zechmeister & Kürster (2009).
Current usage metrics show cumulative count of Article Views (full-text article views including HTML views, PDF and ePub downloads, according to the available data) and Abstracts Views on Vision4Press platform.
Data correspond to usage on the plateform after 2015. The current usage metrics is available 48-96 hours after online publication and is updated daily on week days.
Initial download of the metrics may take a while.