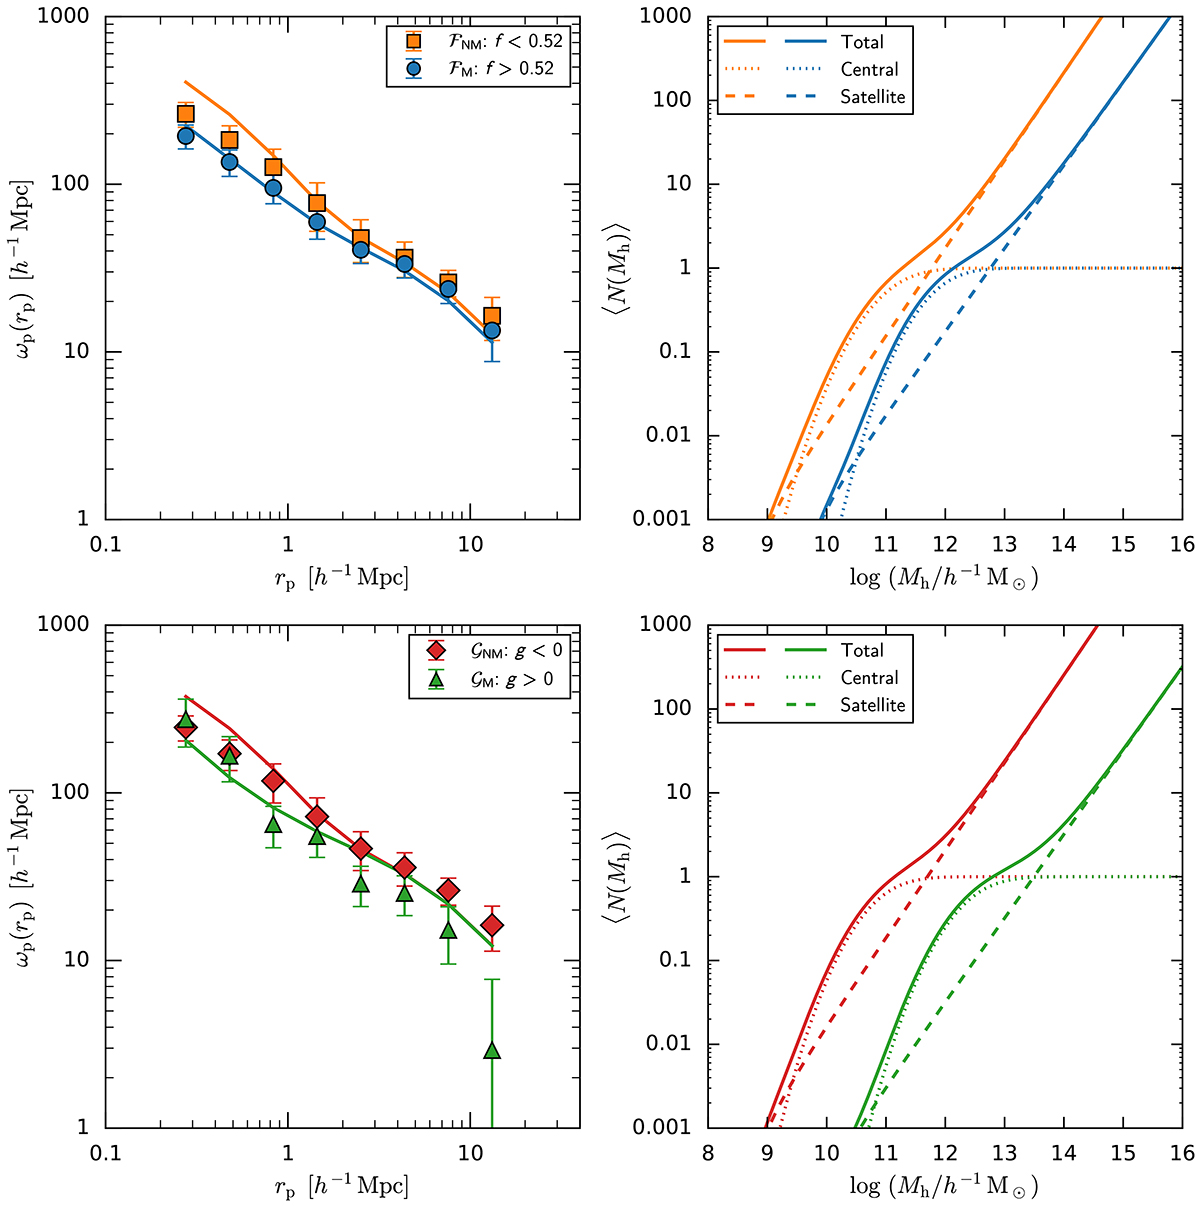
Fig. 7.
Download original image
Projected 2pCFs of the mergers and non-mergers and the best-fitting HOD models (solid curves) when the division was performed based on f (samples ℱM and ℱNM: blue circles and orange squares, respectively, in the top left panel) and g (samples 𝒢M and 𝒢NM: green triangles and red diamonds, respectively, in the bottom left panel). The error bars on the markers are the square root of the diagonals of the covariance matrix obtained from the jackknife resampling method. The right panels show the corresponding total (solid), central (dotted), and satellite (dashed) halo occupation functions.
Current usage metrics show cumulative count of Article Views (full-text article views including HTML views, PDF and ePub downloads, according to the available data) and Abstracts Views on Vision4Press platform.
Data correspond to usage on the plateform after 2015. The current usage metrics is available 48-96 hours after online publication and is updated daily on week days.
Initial download of the metrics may take a while.