Fig. 6
Download original image
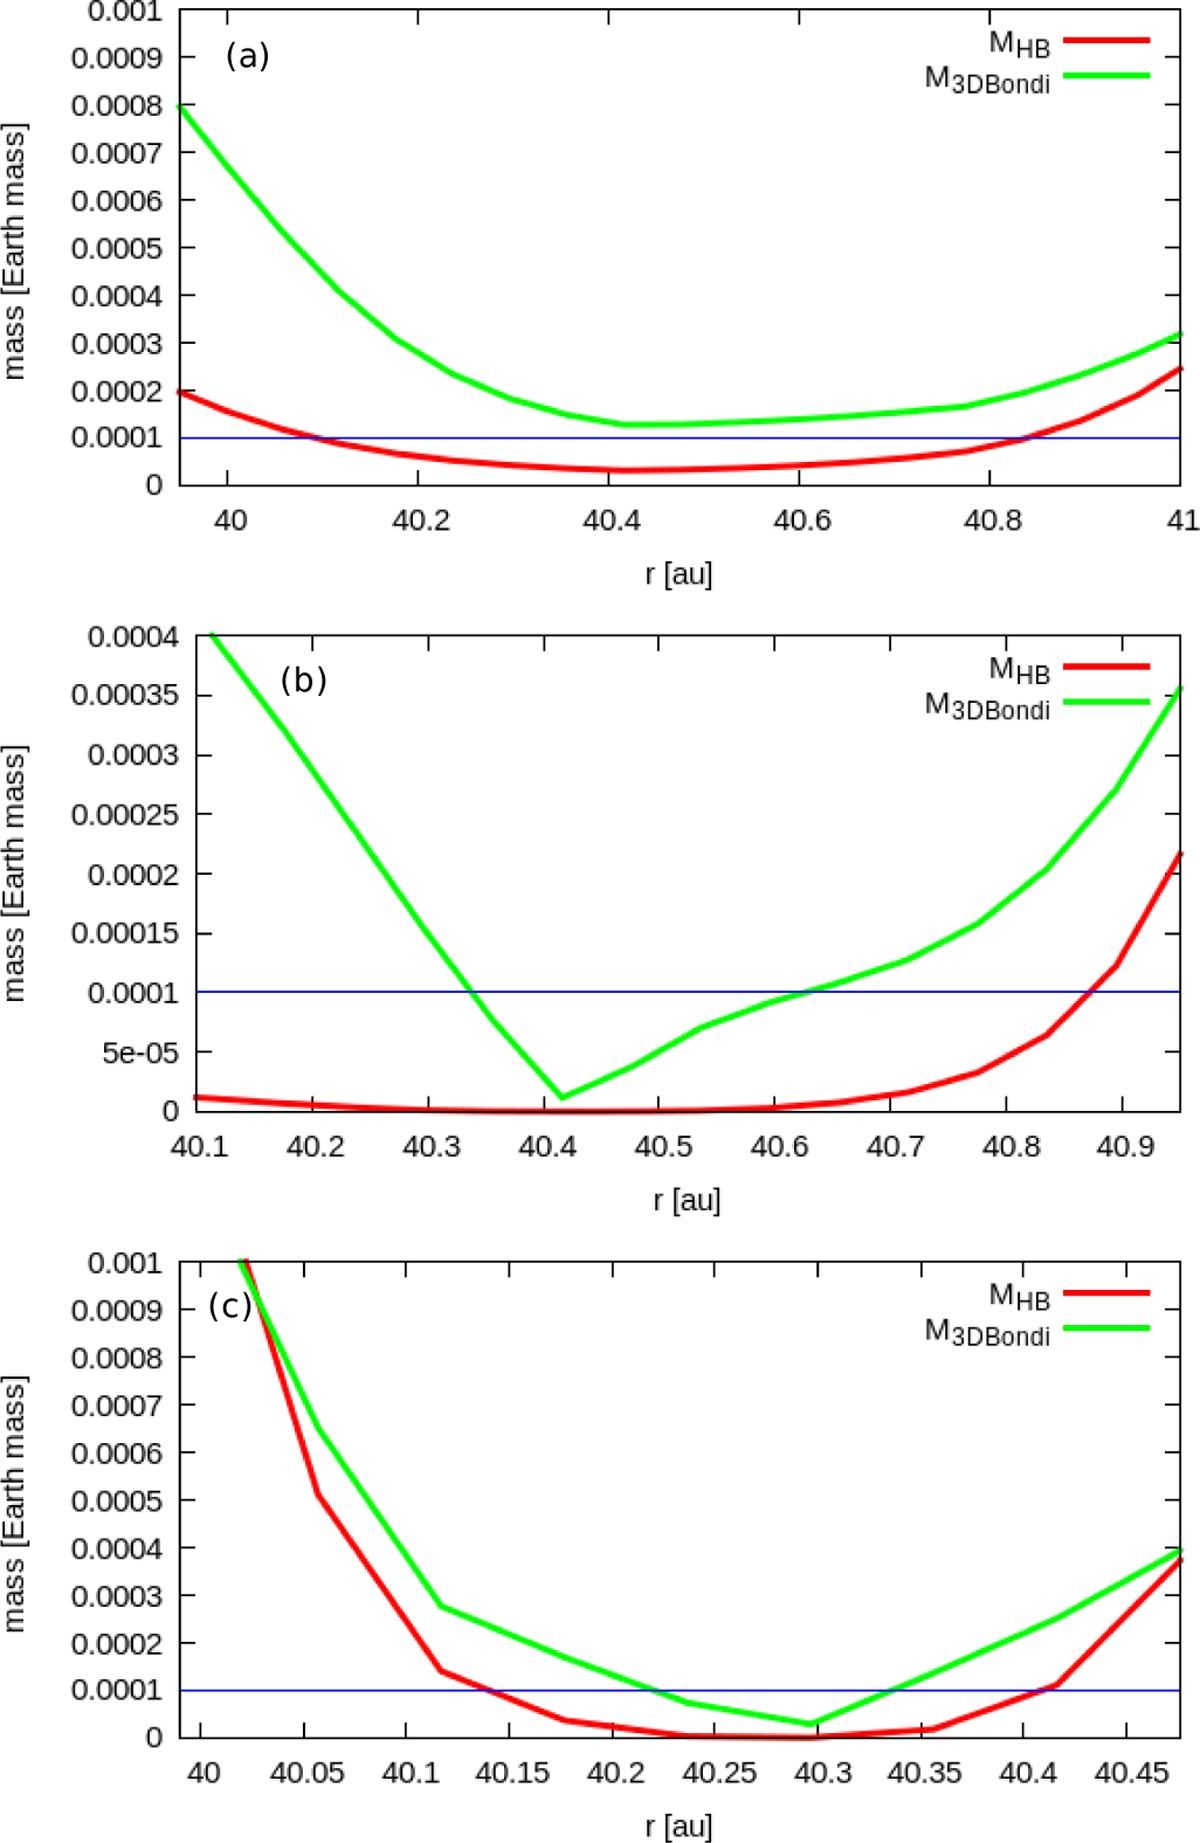
Transition masses (MHB and M3DBondi) as functions of the radial distance around the dust traps. In panel a, δα = 0.2 when the accumulation of solids occurs due to a traffic jam. Panels b and c show the cases in which pressure maxima are developed when δα = 0.15 and δα = 0. 05, respectively. The horizontal line displays the minimum mass of the inserted embryo in our simulations (10−4M⊕).
Current usage metrics show cumulative count of Article Views (full-text article views including HTML views, PDF and ePub downloads, according to the available data) and Abstracts Views on Vision4Press platform.
Data correspond to usage on the plateform after 2015. The current usage metrics is available 48-96 hours after online publication and is updated daily on week days.
Initial download of the metrics may take a while.