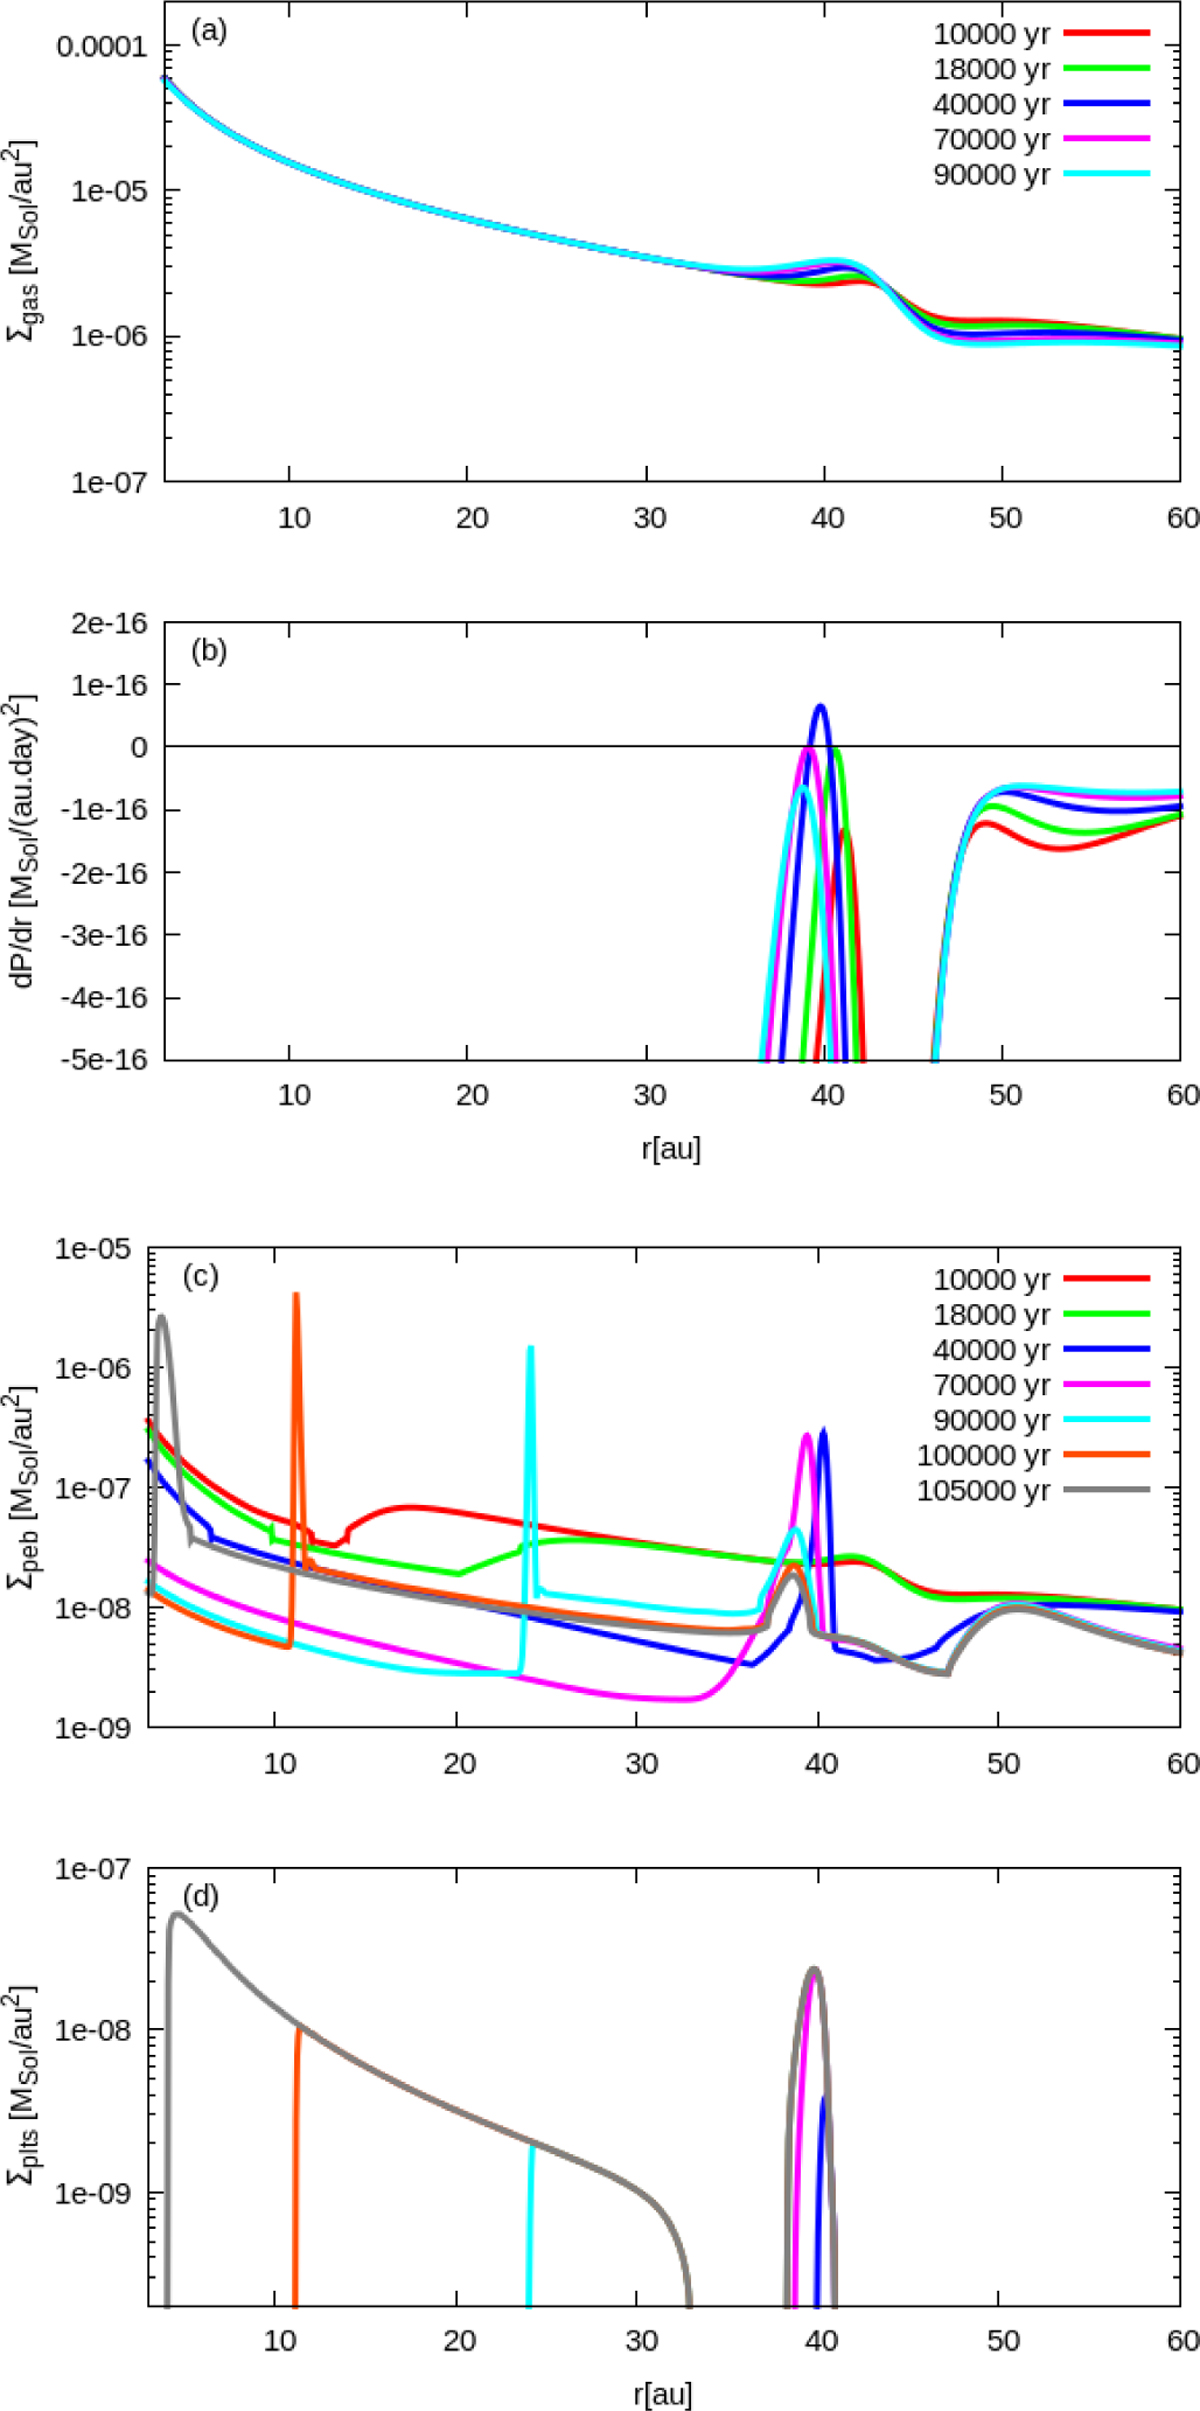
Fig. 4
Download original image
Same as in Fig. 2 but with δα = 0.15. In this case, a temporary pressure maximum develops. The Σgas(r) profiles are shown for different epochs in panel a. In panel b, the curves of the pressure gradient dP/dr are displayed at the same epochs as in the upper panel. Some of the curves of the pressure gradient cross the horizontal axis at zero, and therefore a temporary pressure trap forms within the following range of epochs: 1.8 × 10⁴ < t < 7 × 10⁴ yr.
Current usage metrics show cumulative count of Article Views (full-text article views including HTML views, PDF and ePub downloads, according to the available data) and Abstracts Views on Vision4Press platform.
Data correspond to usage on the plateform after 2015. The current usage metrics is available 48-96 hours after online publication and is updated daily on week days.
Initial download of the metrics may take a while.