Fig. 16
Download original image
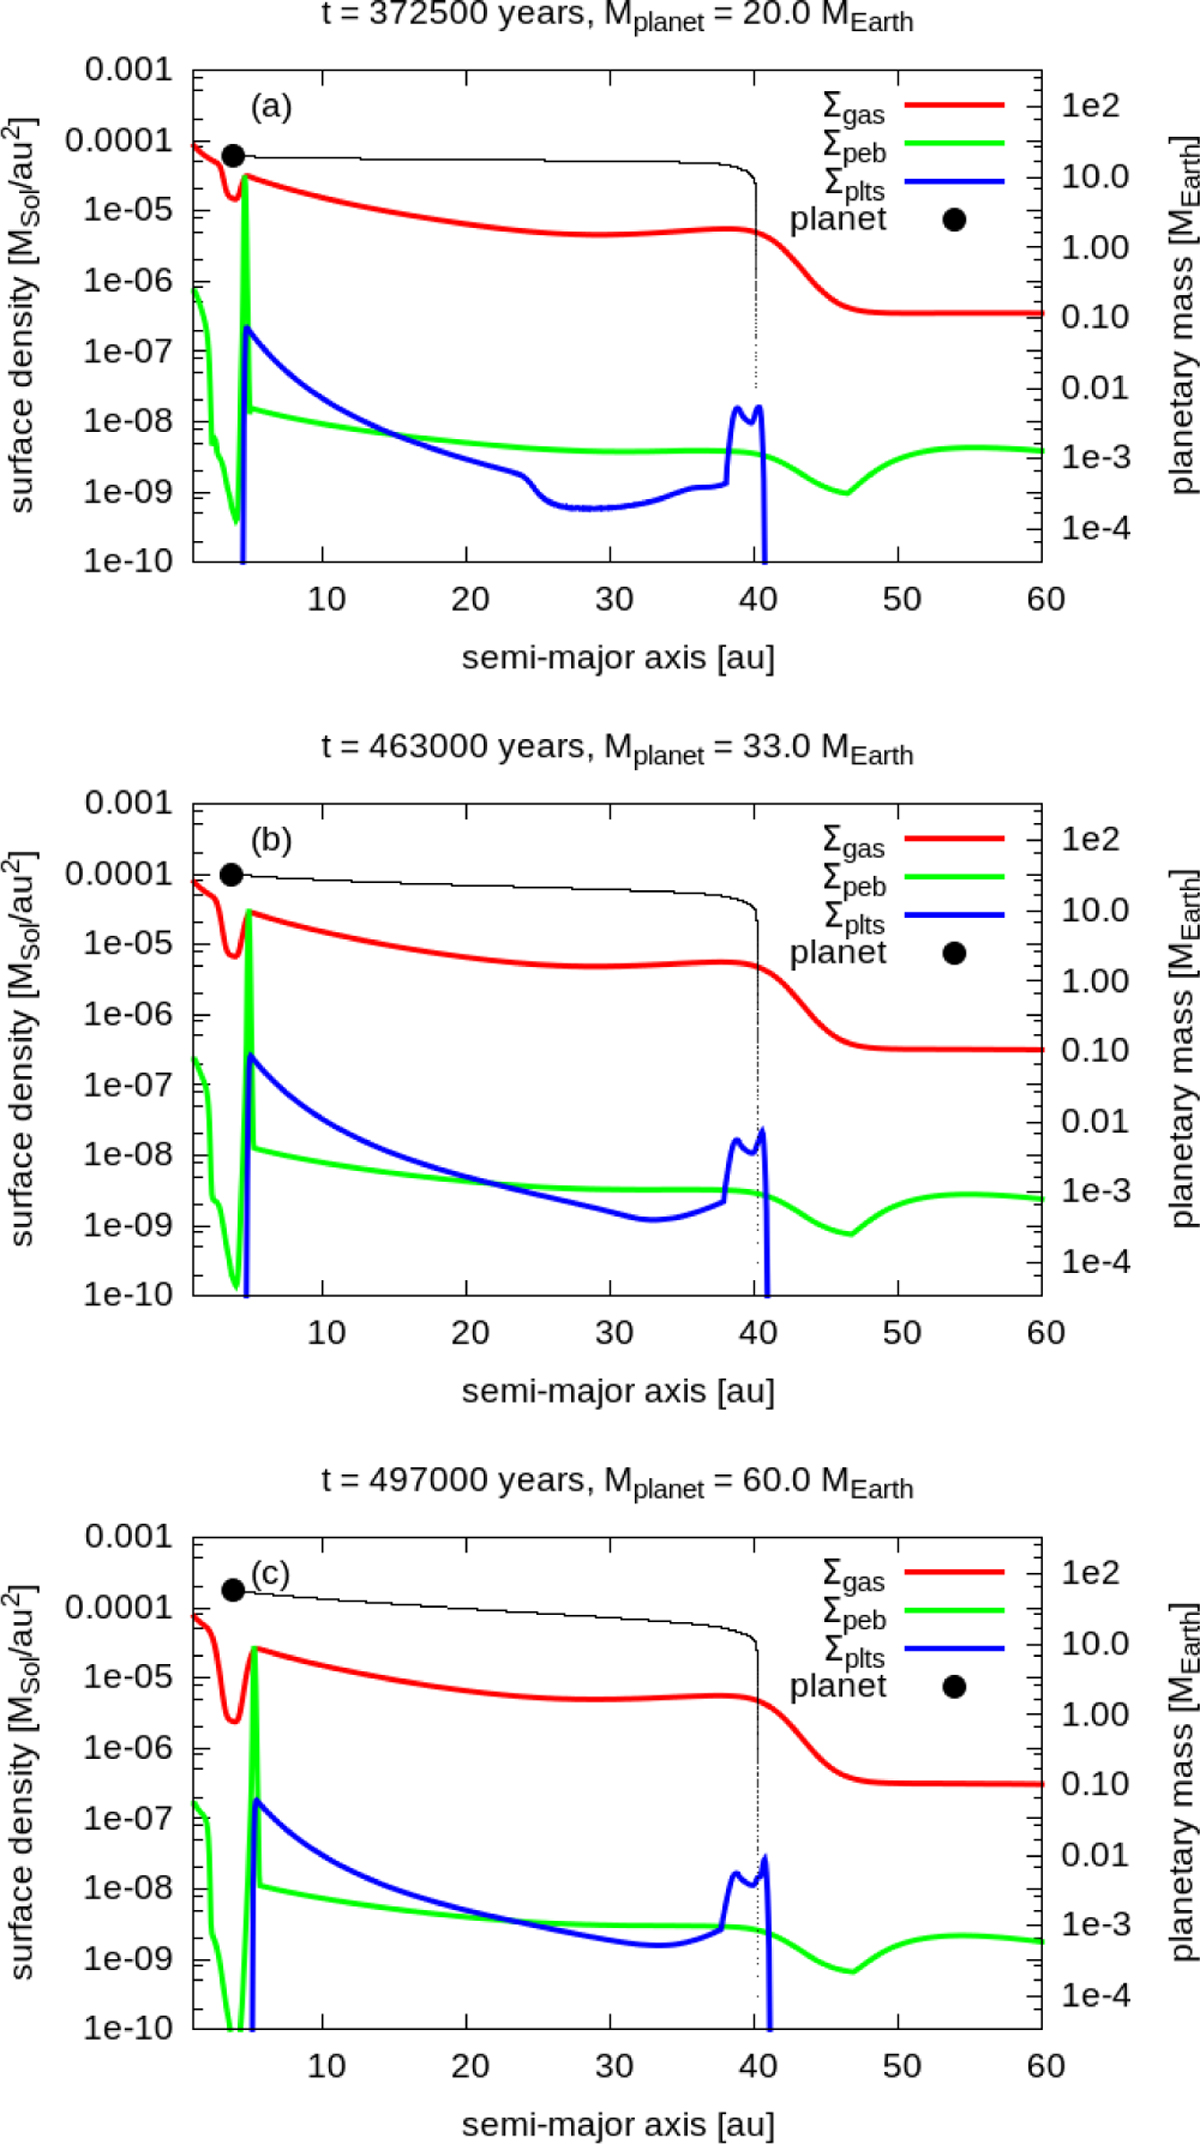
Results of our simulations using parameters δα = 0.05, ζ = 10−4, and reduced migration speed for planet migration. Panel a shows the reference run with unmodified migration speed. Panel b shows the same run but with twice the migration timescale (e.g. with half of the migration speed), while in panel c the migration timescale is three times resulting in third of the migration speed that displayed in panel a. All simulations are run until the planet reaches 3.7 au (which is chosen arbitrarily). The large black dot and the black line in each panel indicate the planet’s position and its track in the apl − mpl plane.
Current usage metrics show cumulative count of Article Views (full-text article views including HTML views, PDF and ePub downloads, according to the available data) and Abstracts Views on Vision4Press platform.
Data correspond to usage on the plateform after 2015. The current usage metrics is available 48-96 hours after online publication and is updated daily on week days.
Initial download of the metrics may take a while.