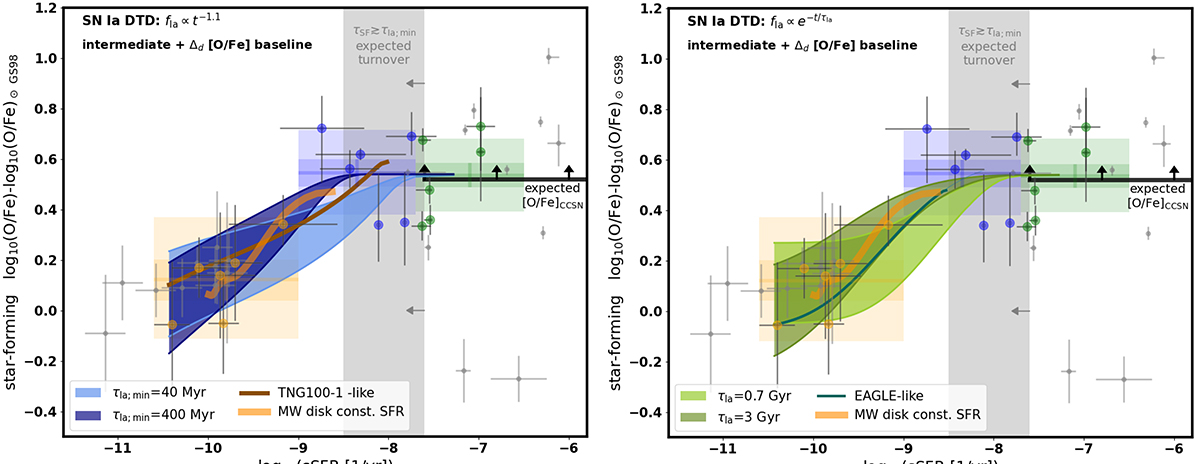
Fig. 8.
Download original image
Observational [O/Fe]–sSFR relation compared with a broad range of theoretical expectations. Data points (big circles) were shifted to a common intermediate [O/Fe] baseline with additional offset due to possible oxygen dust depletion (Δd) included. This baseline provides the closest match to [O/Fe] of metal-poor dwarf stars in the MW from Amarsi et al. (2019) on the high sSFR end (which we use as a lower limit for the expected [O/Fe]CCSN). The average [O/Fe] found in three sSFR bins is shown in the background (see caption of Fig. 7 and Table 1). Small grey data points were not used in the analysis as it is not clear how to consistently correct them for systematic offsets. The grey vertical band indicates the range of sSFR in which we expect the turnover based on the literature SN Ia DTD (see Fig. 2). Dark coloured ranges show the [O/Fe]–sSFR relations calculated with Eq. (1) for different SN Ia DTD and parameter choices. Left panel: power-law DTD with slope αIa = −1.1 and different minimum SN Ia delay times τIa; min. Right panel: exponential DTD for two different values of the τIa parameter. The coloured ranges span between the relations calculated with CIa/CC = 0.74 (upper edges) and CIa/CC = 2.5 (bottom edges) – see text for the details. We also plot the relations followed by TNG100-1-like galaxies (brown line, left panel) and EAGLE-like galaxies (turquoise line, right panel) and the average MW evolutionary track reconstructed with disc stars assuming constant star formation history (thick orange line, see Sect. 3.2).
Current usage metrics show cumulative count of Article Views (full-text article views including HTML views, PDF and ePub downloads, according to the available data) and Abstracts Views on Vision4Press platform.
Data correspond to usage on the plateform after 2015. The current usage metrics is available 48-96 hours after online publication and is updated daily on week days.
Initial download of the metrics may take a while.