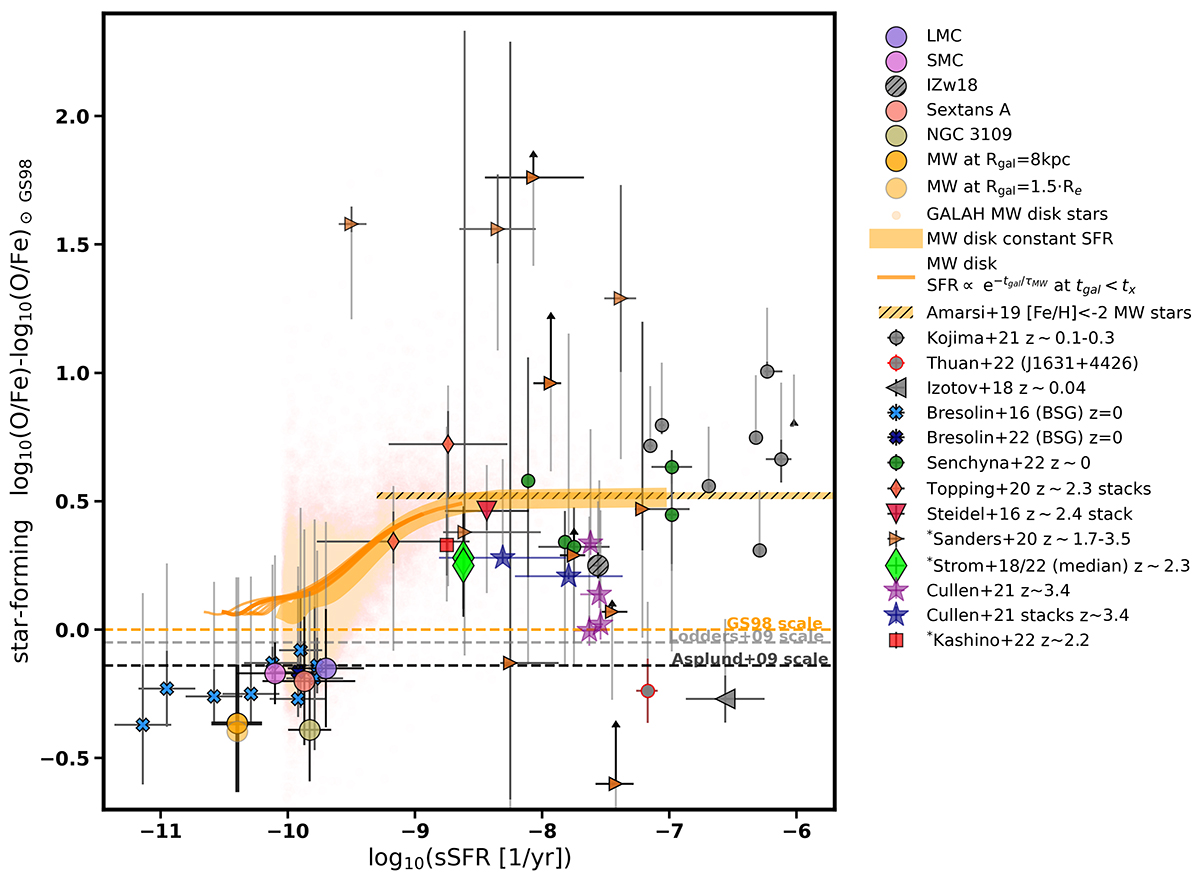
Fig. 6.
Download original image
Observational estimates of the star-forming [O/Fe] versus sSFR for the MW (estimated at Rgal = 8 kpc and at 1.5 × Re effective radius), nearby dwarf galaxies (LMC, SMC, IZw 18, Sextans A, NGC 3109), local galaxies with blue supergiant-based metallicity estimates from Bresolin et al. (2016, 2022), extremely metal-poor dwarf galaxies from Senchyna et al. (2022), Kojima et al. (2021), Thuan et al. (2022), and Izotov et al. (2018), and high-redshift star-forming galaxies/stacks from Steidel et al. (2016), Cullen et al. (2021), and Topping et al. (2020). For the remaining high-redshift estimates (marked with * in the legend), either the iron or oxygen abundance was inferred indirectly. Light grey extensions of the error bars indicate known sources of systematic uncertainty in the abundance determination (see text and Table E.1). Small orange points show the MW disc stars and orange curves indicate part of the MW disc evolutionary track in the diagram (see Sect. 3.2 and Fig. 5). Horizontal hatched bar at [O/Fe] ≈ 0.52 dex indicates the average abundance ratio of the MW thick disc/halo dwarf stars with [Fe/H] < –2 from Amarsi et al. (2019) (x-axis value is arbitrary). Only the offsets due to different reference solar abundances choices were corrected in this figure. Horizontal lines indicate zero points for different reference solar O and Fe abundance choices. There is a 0.14 dex offset between the Grevesse & Sauval (1998) (GS98, orange dashed line) scale used here and the commonly used Asplund et al. (2009) solar scale (black dashed line).
Current usage metrics show cumulative count of Article Views (full-text article views including HTML views, PDF and ePub downloads, according to the available data) and Abstracts Views on Vision4Press platform.
Data correspond to usage on the plateform after 2015. The current usage metrics is available 48-96 hours after online publication and is updated daily on week days.
Initial download of the metrics may take a while.