Fig. 5.
Download original image
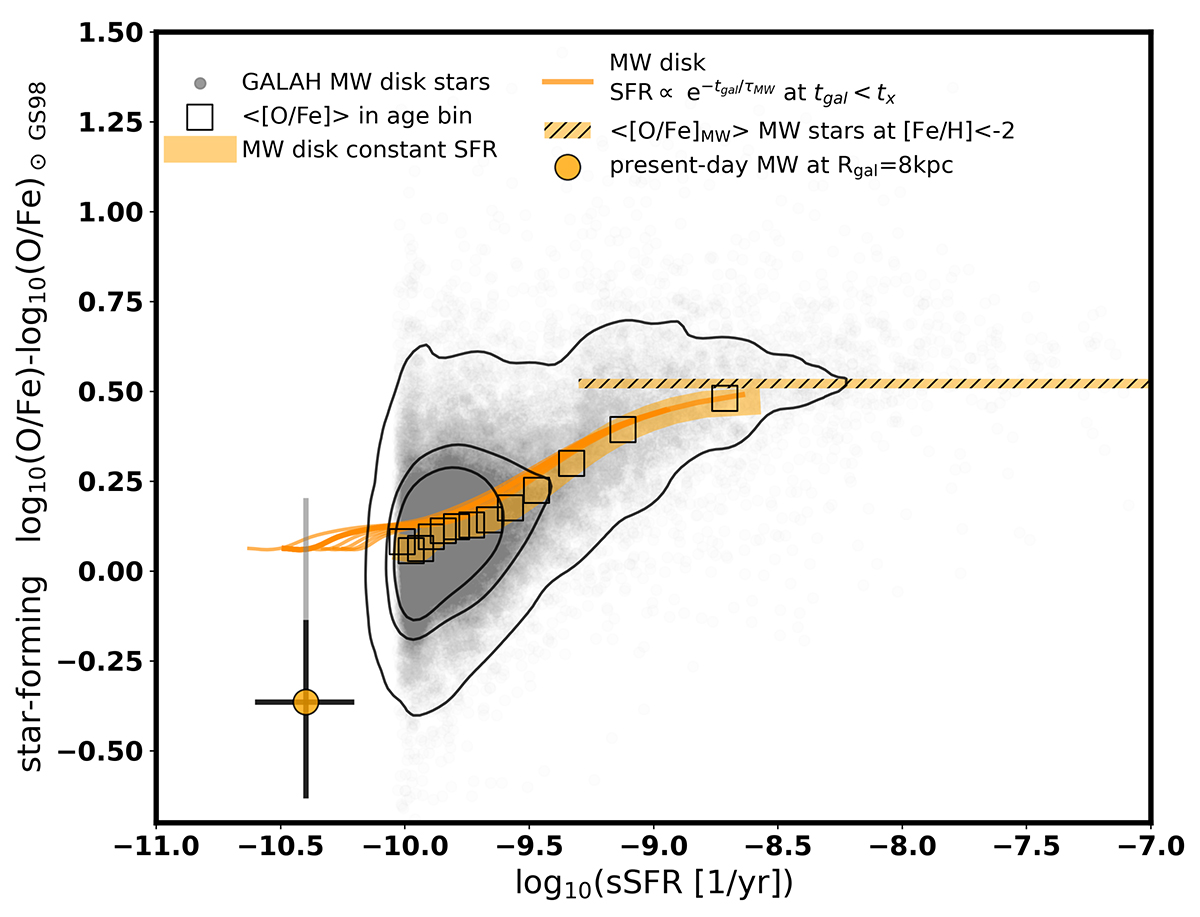
MW-based star-forming [O/Fe] versus sSFR relation. The big data point corresponds to the present-day MW, where the light grey extension of the error bars indicates the systematic uncertainty (see text and Table E.1). Grey points: [O/Fe] of the MW disc MS turn-off stars from GALAH DR3 with sSFR estimated from stellar ages assuming constant MW disc star formation history. Contours enclose 50%, 68%, and 95 % of stars in the diagram. Black empty squares indicate the average [O/Fe] of those stars grouped in 14 age bins (see Table B.1). Orange curves show part of the MW evolutionary track in the diagram reconstructed using binned ages and average [O/Fe] for different assumptions about the disc star formation history (see text for the details). The horizontal hatched bar at [O/Fe] ≈ 0.52 dex shows the average abundance ratio of the MW thick disc/halo dwarf stars with [Fe/H] < −2 from Amarsi et al. (2019) (x-axis value is arbitrary).
Current usage metrics show cumulative count of Article Views (full-text article views including HTML views, PDF and ePub downloads, according to the available data) and Abstracts Views on Vision4Press platform.
Data correspond to usage on the plateform after 2015. The current usage metrics is available 48-96 hours after online publication and is updated daily on week days.
Initial download of the metrics may take a while.