Fig. 4.
Download original image
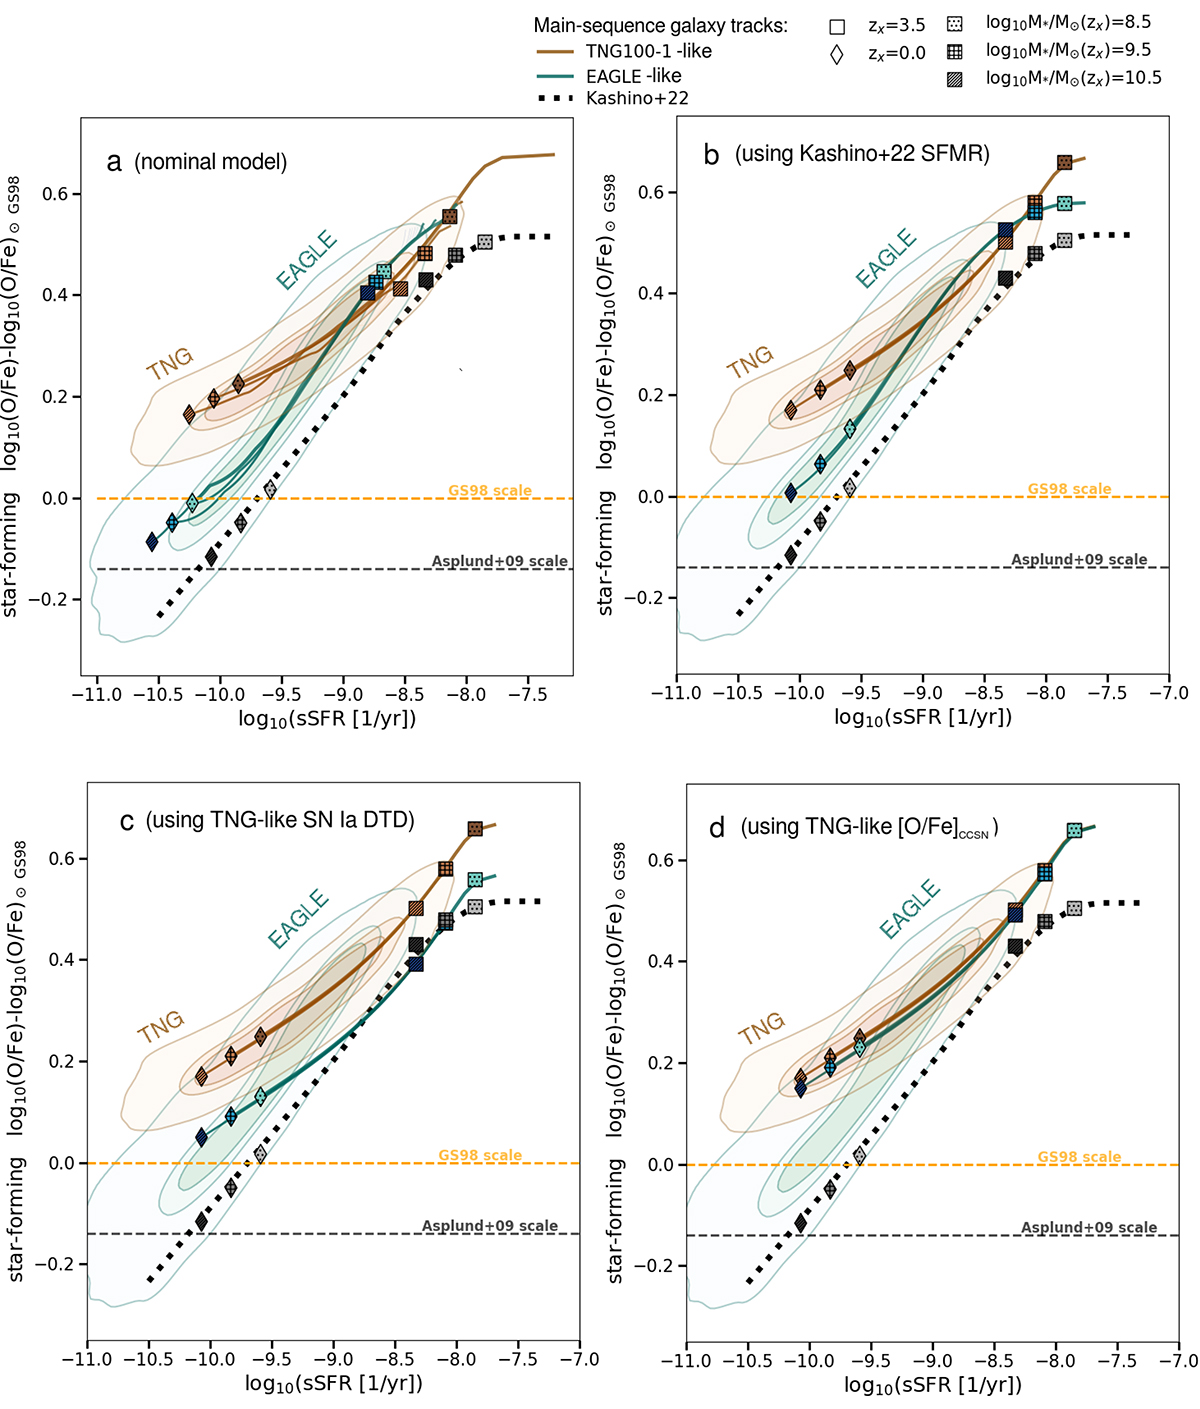
Star-forming [O/Fe] – log10(sSFR) relation for the simulated galaxies from the EAGLE cosmological simulations (turquoise contours), for the simulated galaxies from the TNG 100 cosmological simulations (brown contours), and those obtained by Kashino et al. (2022) (black dotted line). The contours enclose 50, 68 and 95 % of all central galaxies with log10(M*/M⊙) = 9–10.5 at redshifts between 0 and 8. The thick solid lines show evolutionary tracks of MS galaxies along the relation calculated with Eq. (1) for different parameter choices. Squares/diamonds show the locations of galaxies of different masses (indicated by the symbol shading) at redshift 3.5/0. The tracks in panel a were calculated using the SFMR, DTD, ![]() , kCCSN and NIa0 from the EAGLE (turquoise) or TNG (brown) simulations (see Appendix A). The remaining parameters are chosen to match the relation resulting from the EAGLE or TNG simulations, respectively. In panel b all tracks were caluclated with the same SFMR as in Kashino et al. (2022). In panel c we additionally change the DTD for turquoise tracks to the one used in the TNG simulations. In panel d we further change [O/Fe]CCSN used to calculate the turquoise tracks to be the same as used to calculate the brown tracks.
, kCCSN and NIa0 from the EAGLE (turquoise) or TNG (brown) simulations (see Appendix A). The remaining parameters are chosen to match the relation resulting from the EAGLE or TNG simulations, respectively. In panel b all tracks were caluclated with the same SFMR as in Kashino et al. (2022). In panel c we additionally change the DTD for turquoise tracks to the one used in the TNG simulations. In panel d we further change [O/Fe]CCSN used to calculate the turquoise tracks to be the same as used to calculate the brown tracks.
Current usage metrics show cumulative count of Article Views (full-text article views including HTML views, PDF and ePub downloads, according to the available data) and Abstracts Views on Vision4Press platform.
Data correspond to usage on the plateform after 2015. The current usage metrics is available 48-96 hours after online publication and is updated daily on week days.
Initial download of the metrics may take a while.