Fig. 3.
Download original image
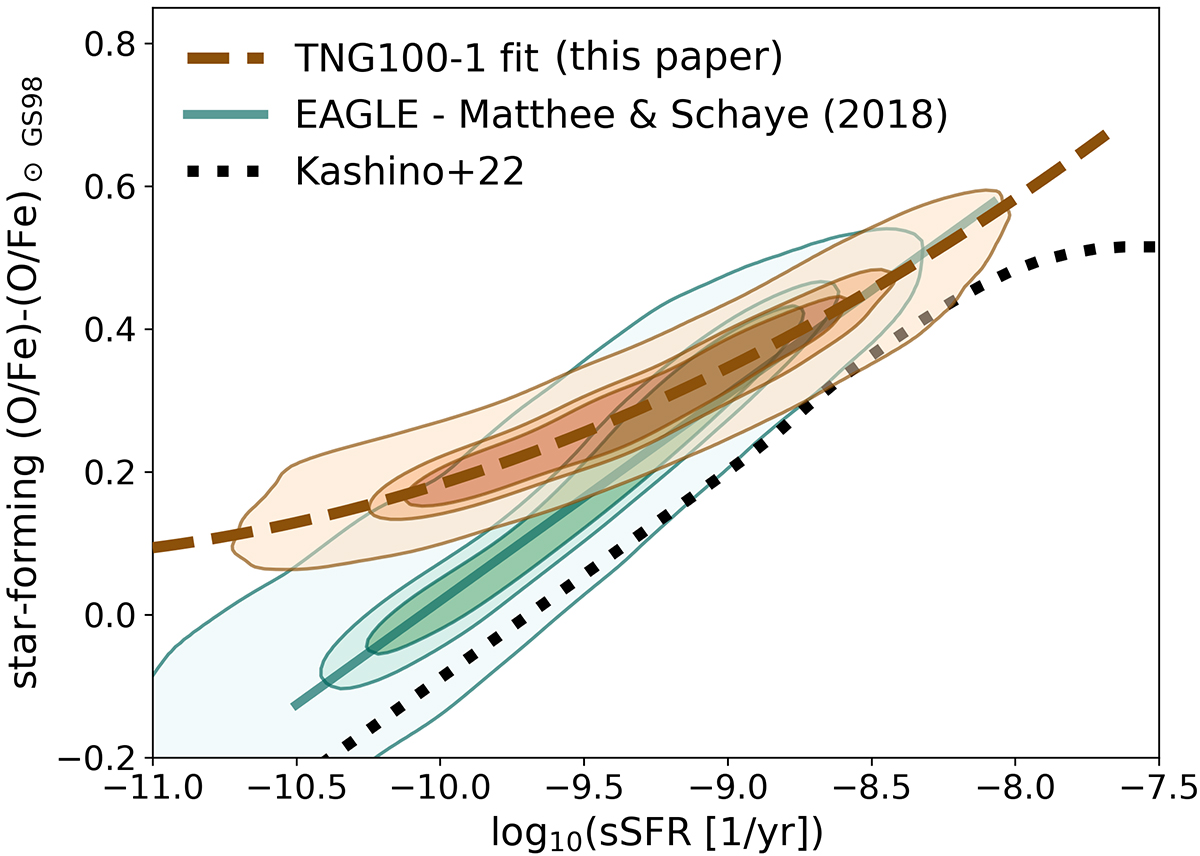
Star-forming [O/Fe] versus sSFR relation for simulated galaxies from the EAGLE cosmological simulations (turquoise contours) and TNG 100 cosmological simulations (brown contours). The contours enclose 50, 68, and 95 % of all central galaxies with log10(M*/M⊙) = 9–10.5 at redshifts between 0 and 8. The solid turquoise line shows the fit to the relation in EAGLE from Matthee & Schaye (2018), while the dashed brown line shows our fit to the relation in TNG 100. The black dotted line shows the relation obtained by Kashino et al. (2022) for MS galaxies modeled within the gas-regulator framework.
Current usage metrics show cumulative count of Article Views (full-text article views including HTML views, PDF and ePub downloads, according to the available data) and Abstracts Views on Vision4Press platform.
Data correspond to usage on the plateform after 2015. The current usage metrics is available 48-96 hours after online publication and is updated daily on week days.
Initial download of the metrics may take a while.