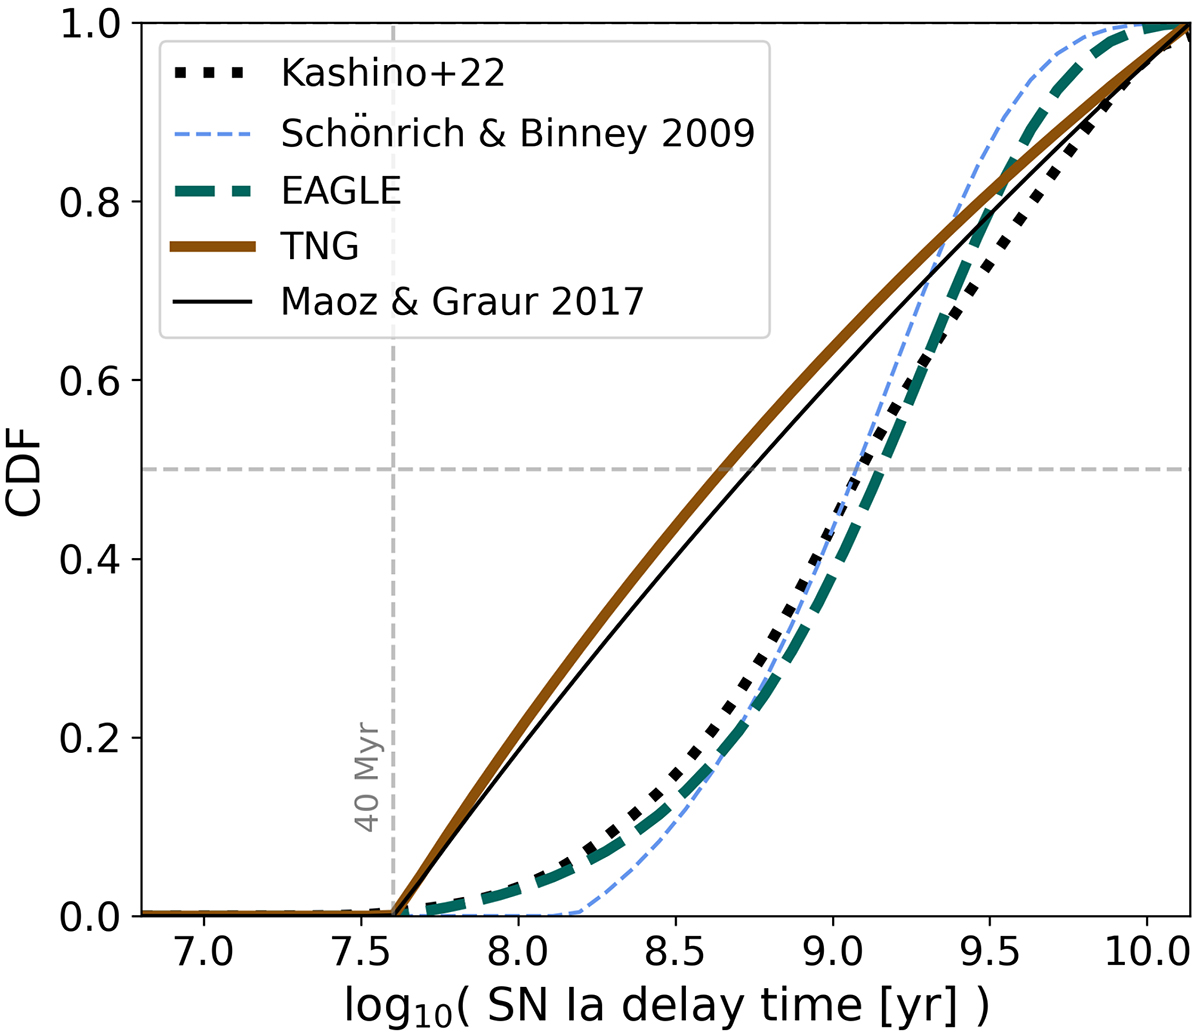
Fig. 2.
Download original image
Cumulative distribution functions of the example SN Ia DTD. The distributions were normalised to unity when integrated over the Hubble time. Solid lines correspond to single power-law-shaped DTD: brown – TNG cosmological simulations, black – fitted to the observed SN Ia volumetric rate by Maoz & Graur (2017). Dashed lines correspond to the exponential DTD: thick turquoise line – EAGLE cosmological simulations, thin blue line – Galaxy chemical evolution model from Schönrich & Binney (2009) with DTD parameters tuned to reproduce observed oxygen abundances. The black dotted line corresponds to the DTD used by Kashino et al. (2022), which follows the theoretical analytic formulation by Greggio (2005, 2010) allowing for a mixed contribution of different proposed SN Ia progenitors. The intersection with the horizontal dashed line indicates the median of each DTD. The vertical dashed line at 40 Myr marks the evolutionary timescale of an 8 M⊙ star (i.e. roughly the minimum time needed to form a white dwarf).
Current usage metrics show cumulative count of Article Views (full-text article views including HTML views, PDF and ePub downloads, according to the available data) and Abstracts Views on Vision4Press platform.
Data correspond to usage on the plateform after 2015. The current usage metrics is available 48-96 hours after online publication and is updated daily on week days.
Initial download of the metrics may take a while.