Fig. E.1.
Download original image
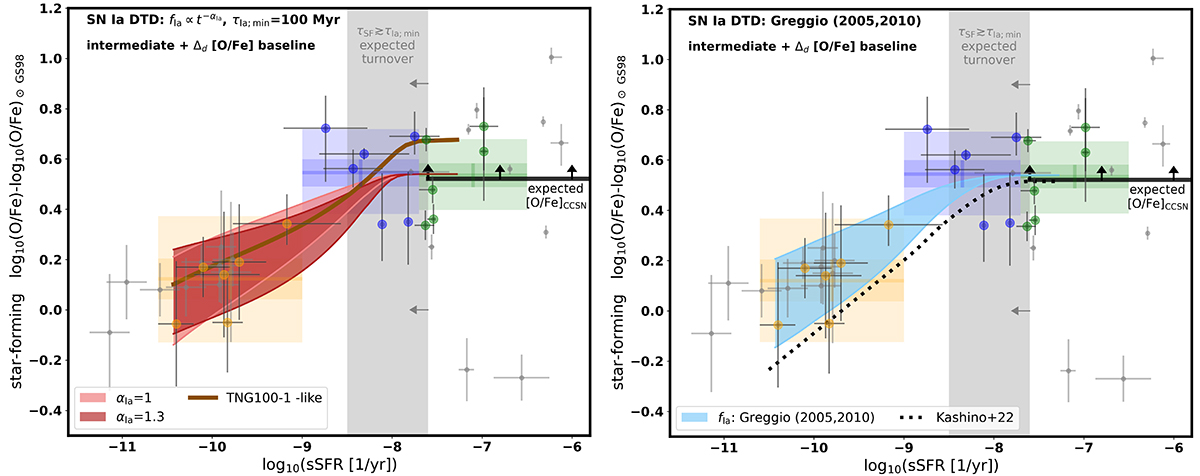
Observational [O/Fe]–sSFR relation compared with a range of model relations. Data points (big circles) were shifted to a common intermediate [O/Fe] baseline with additional offset due to possible oxygen dust depletion (Δd) included (see Figure 8 and Section 5). Dark coloured ranges show the [O/Fe]–sSFR relations calculated with 1 for different SN Ia DTD and parameter choices. Left panel: power-law DTD with the minimum SN Ia delay time τIa; min = 100 Myr and different slopes αIa. Right panel: analytic DTD for mixed single degenerate and double degenerate SN Ia scenario from Greggio (2005, 2010), as used by Kashino et al. (2022). The coloured ranges span between the relations calculated with CIa/CC = 0.74 (upper edges) and CIa/CC = 2.5 (bottom edges) – see text for the details. We also plot the relations followed by TNG100-1-like galaxies (brown line, left panel) and the relation from Kashino et al. (2022) (black dotted line, right panel).
Current usage metrics show cumulative count of Article Views (full-text article views including HTML views, PDF and ePub downloads, according to the available data) and Abstracts Views on Vision4Press platform.
Data correspond to usage on the plateform after 2015. The current usage metrics is available 48-96 hours after online publication and is updated daily on week days.
Initial download of the metrics may take a while.