Fig. B.4.
Download original image
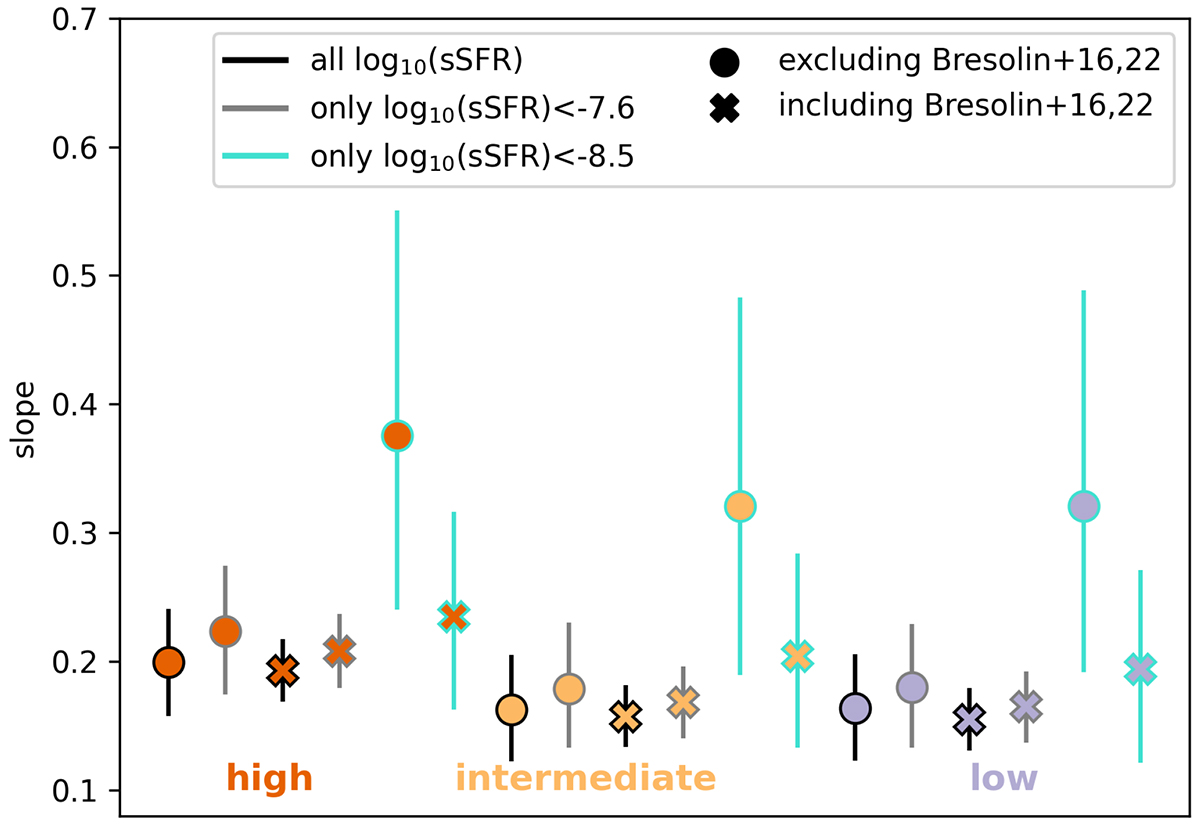
Slope of the linear fit to the [O/Fe]–log10(sSFR) relation for different choices of the baseline (colours) and including/excluding of the sample from Bresolin et al. (2016, 2022) at low sSFR (crosses/circles). We show the result obtained when fitting only the slope at log10(sSFR) < − 7.6 (symbols with grey edges), at log10(sSFR) < − 8.5 (symbols with blue edges) or when fitting the slope to the full sample (black edges). Error bars range from 16 to 84 percentiles of the fits, the symbol indicates the median.
Current usage metrics show cumulative count of Article Views (full-text article views including HTML views, PDF and ePub downloads, according to the available data) and Abstracts Views on Vision4Press platform.
Data correspond to usage on the plateform after 2015. The current usage metrics is available 48-96 hours after online publication and is updated daily on week days.
Initial download of the metrics may take a while.