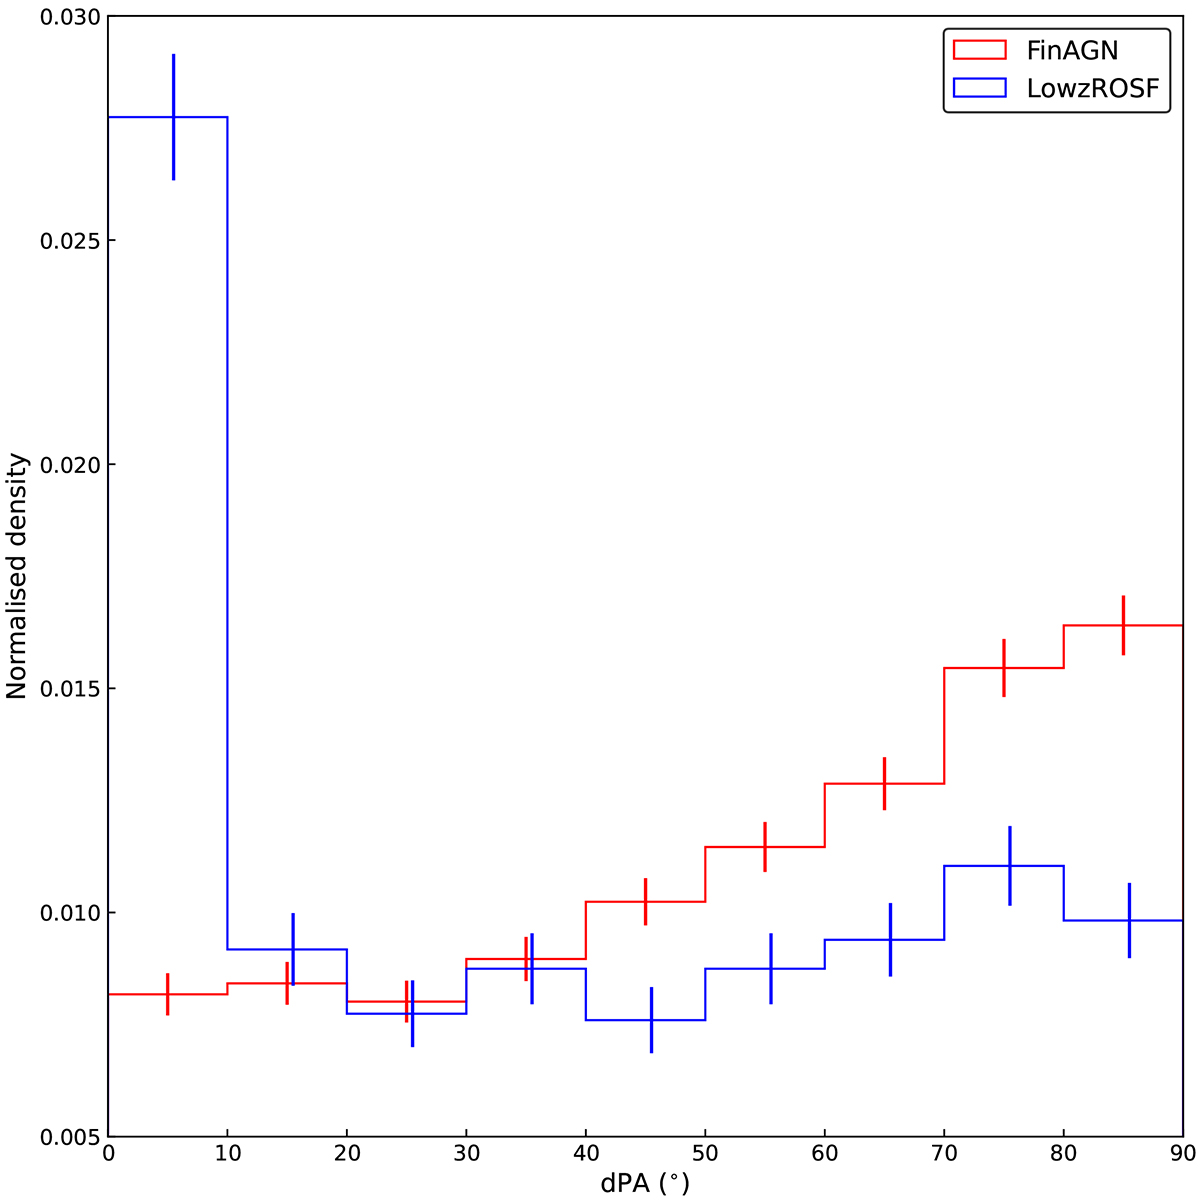
Fig. 7.
Download original image
Alignment distributions for the two samples. The FinAGN and LowzROSF samples are shown as red and blue histograms respectively. The error bars for the LowzROSF sample are offset for clarity. The histograms are normalised to make the integration of the histograms equal to one. The errorbars (and the errorbars in the histograms throughout the work) are derived from Poissonian errors.
Current usage metrics show cumulative count of Article Views (full-text article views including HTML views, PDF and ePub downloads, according to the available data) and Abstracts Views on Vision4Press platform.
Data correspond to usage on the plateform after 2015. The current usage metrics is available 48-96 hours after online publication and is updated daily on week days.
Initial download of the metrics may take a while.