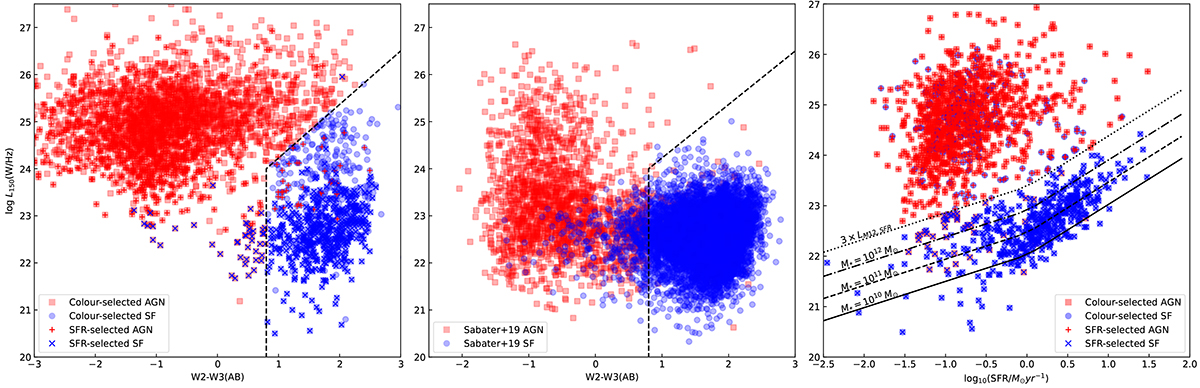
Fig. 4.
Download original image
Radio AGN/star-forming galaxy classification diagrams. Left: radio luminosity and W2 − W3 AB colours for the radio sources in the LowzRO sample in this work. The red squares and blue circles show the radio-AGNs and star-forming galaxies classified based on the WISE colour respectively. The red “+” and blue “x” markers show the radio-AGNs and star forming galaxies classified based on the SFR from the MPA-JHU value-added catalogue (Brinchmann et al. 2004). Middle: radio luminosity and W2 − W3 AB colours for the sources in Sabater et al. (2019) based on the low redshift LoTSS DR1 sample (z < 0.3). The red squares and blue circles denote the radio-AGN and star forming galaxies classified based on radio luminosity, spectroscopic information and WISE colours in Sabater et al. (2019). The dashed lines in the left and middle panels show the AGN/star forming division lines used in the WISE-colour classifications. Right: radio luminosity and the SFR for the radio sources in the LowzRO sample with SFR measurements. The symbols have similar meaning as in the left panel. The black solid line shows the expected L150 MHz from star formation for galaxies with M⋆ = 1010 M⊙ following the relation in Gürkan et al. (2018). The black dashed, dot dashed lines show the expected L150 MHz from star formation for galaxies with M⋆ = 1011 M⊙ and 1012 M⊙ respectively. The dotted line shows the division line used in the SFR-base classification in this work, i.e. three times the expected L150 MHz for galaxies with M⋆ = 1012 M⊙.
Current usage metrics show cumulative count of Article Views (full-text article views including HTML views, PDF and ePub downloads, according to the available data) and Abstracts Views on Vision4Press platform.
Data correspond to usage on the plateform after 2015. The current usage metrics is available 48-96 hours after online publication and is updated daily on week days.
Initial download of the metrics may take a while.