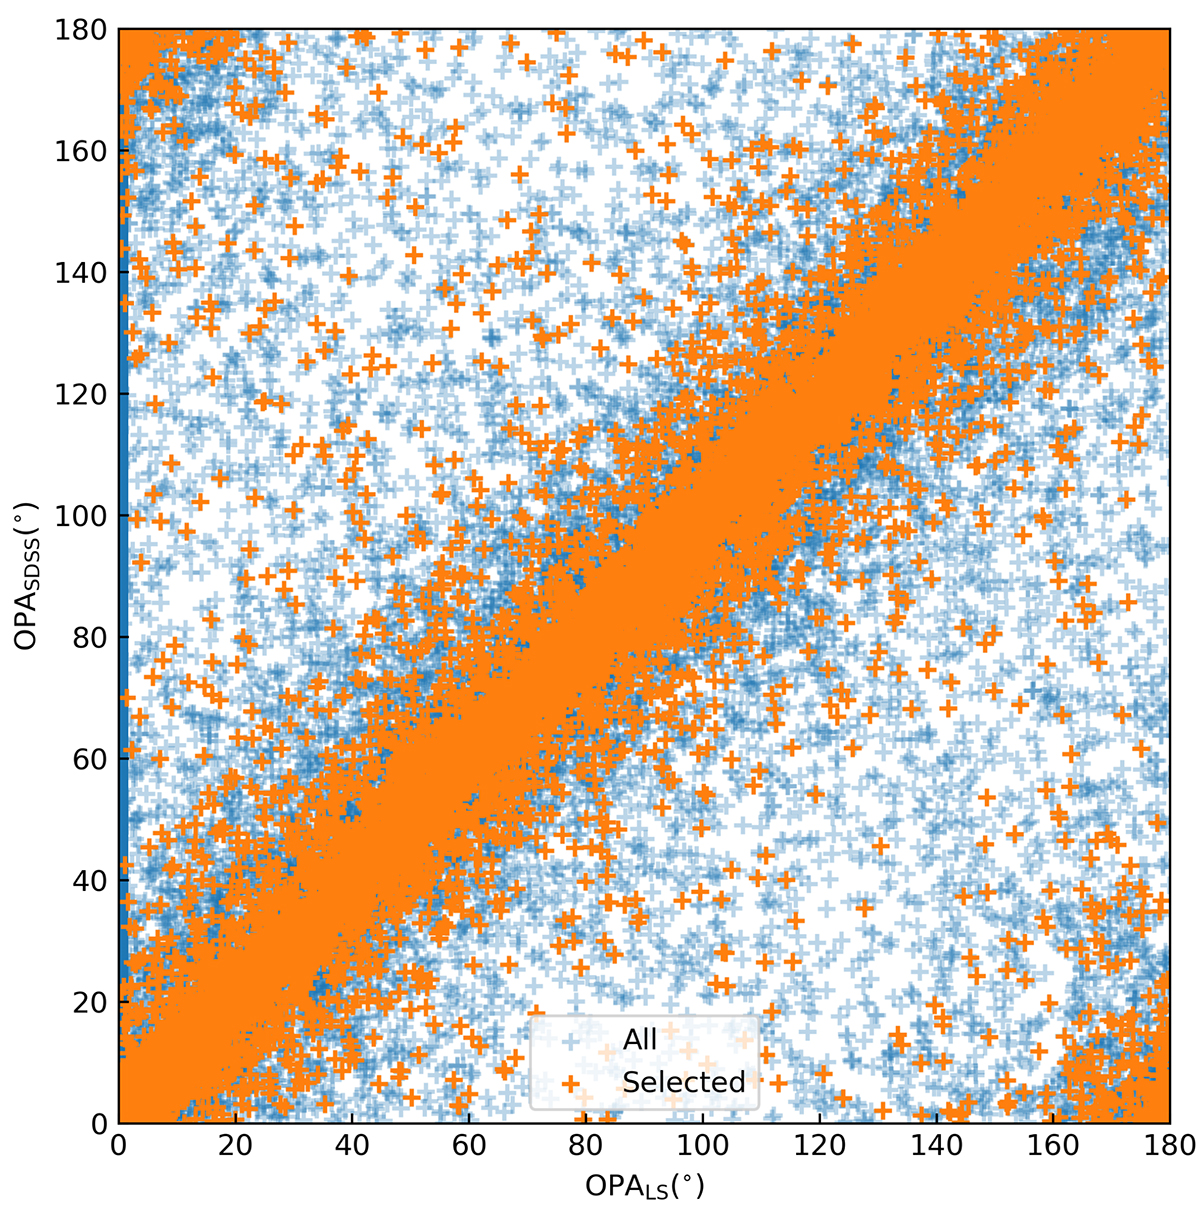
Fig. 3.
Download original image
Optical position angles of sources with detections in both the Legacy Surveys and the SDSS in this work. The x-coordinates denote the OPAs in the Legacy Surveys and the y-coordinates denote the OPAs in the SDSS. The blue symbols are all the LS-SDSS sources before adopting criteria (6)–(8). The orange symbols the LS-SDSS sources selected by criteria (6)–(8). The orange symbols are overplotted on top of the blue symbols. The two clusters in the upper left and lower right corners also correspond to the consistency of OPAs in the Legacy Surveys and the SDSS, because of the continuity of PA measures below 0° and above 180°. In the final sample, the sources with inconsistent OPAs in the two surveys (unsuited sources in text) in the LS-SDSS sample are excluded in the analyses.
Current usage metrics show cumulative count of Article Views (full-text article views including HTML views, PDF and ePub downloads, according to the available data) and Abstracts Views on Vision4Press platform.
Data correspond to usage on the plateform after 2015. The current usage metrics is available 48-96 hours after online publication and is updated daily on week days.
Initial download of the metrics may take a while.