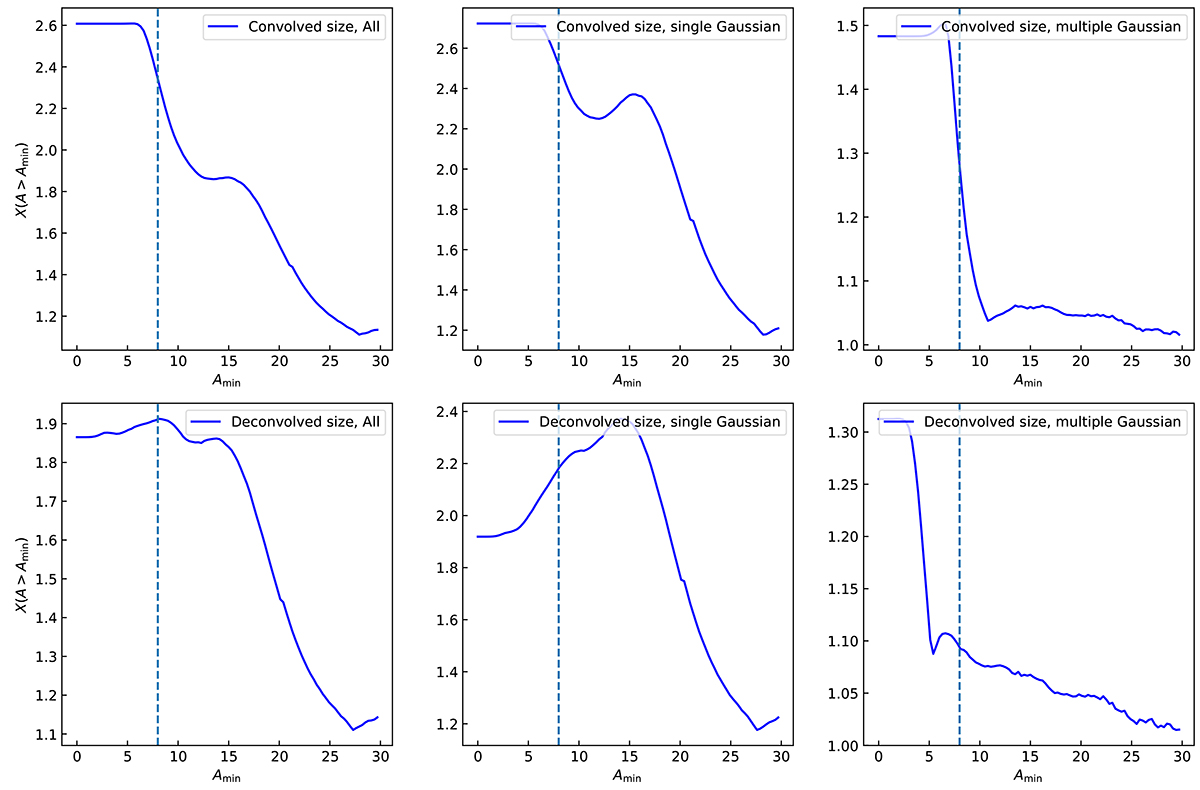
Fig. 2.
Download original image
Peak excess X(A > Amin) of radio sources in the LoTSS DR2 VAC with different minimum source angular sizes Amin (convolved or deconvolved major axis). Top panels: peak excess as a function of the minimum convolved sizes. Bottom panels: peak excess as a function of the minimum deconvolved sizes. The peak excess for all radio sources, single Gaussian radio sources and multiple Gaussian radio sources are shown from left to right respectively. The dashed lines in each panel denote a minimum size of 8″.
Current usage metrics show cumulative count of Article Views (full-text article views including HTML views, PDF and ePub downloads, according to the available data) and Abstracts Views on Vision4Press platform.
Data correspond to usage on the plateform after 2015. The current usage metrics is available 48-96 hours after online publication and is updated daily on week days.
Initial download of the metrics may take a while.