Open Access
Fig. 18.
Download original image
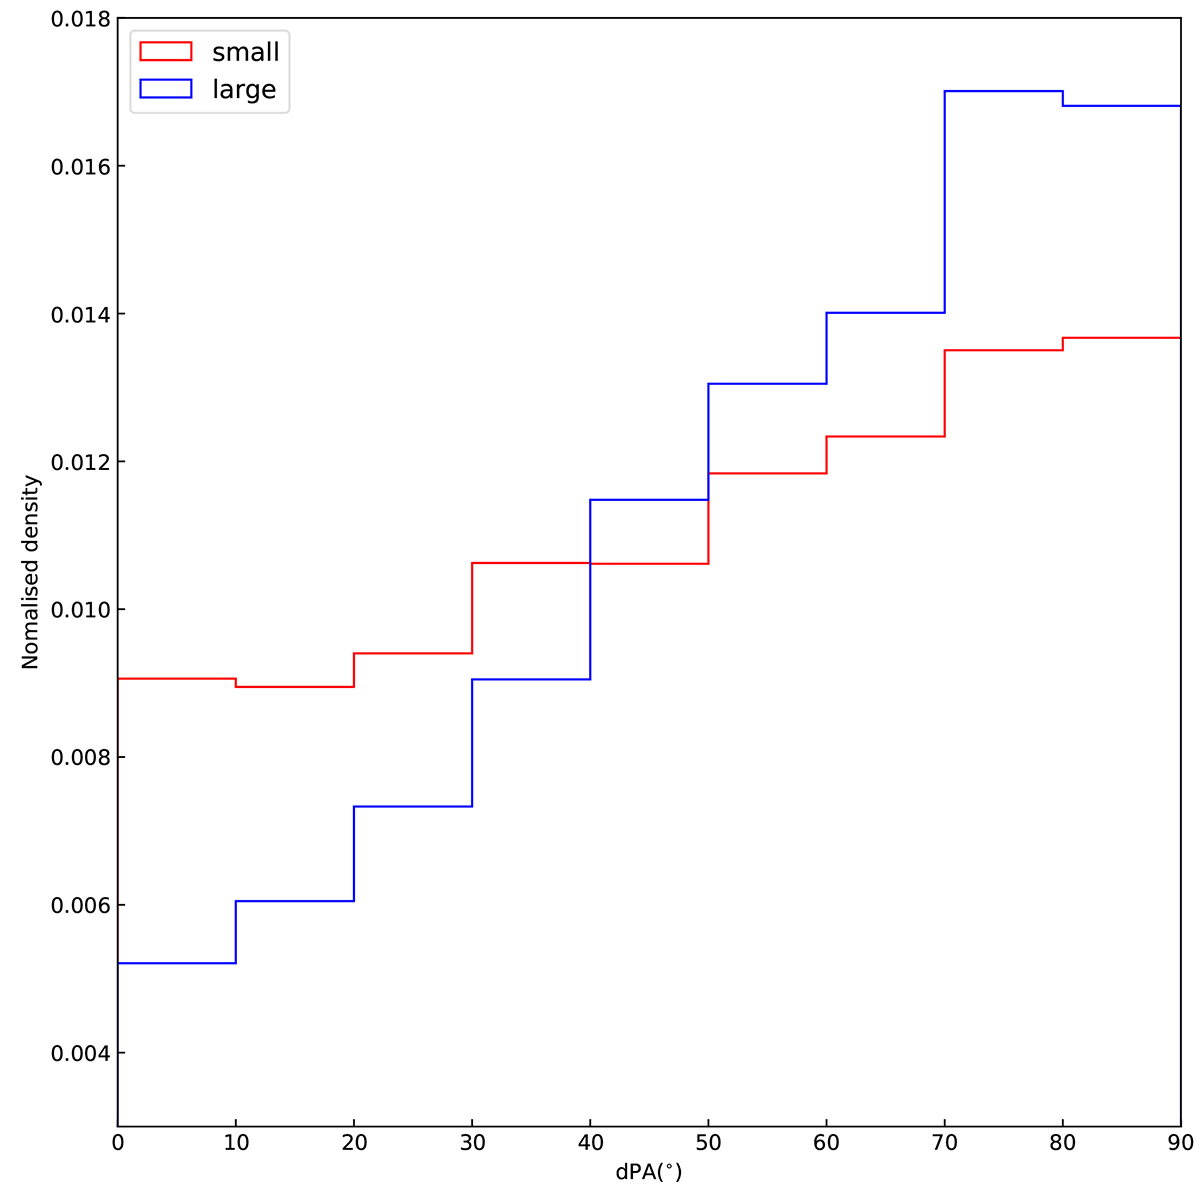
Simulated dPA distributions of two subsamples with different projected linear sizes in a toy model. The red histogram denotes the simulated subsample with smaller projected sizes. The blue histogram represents the b/a-controlled sample with larger projected sizes.
Current usage metrics show cumulative count of Article Views (full-text article views including HTML views, PDF and ePub downloads, according to the available data) and Abstracts Views on Vision4Press platform.
Data correspond to usage on the plateform after 2015. The current usage metrics is available 48-96 hours after online publication and is updated daily on week days.
Initial download of the metrics may take a while.