Fig. 13.
Download original image
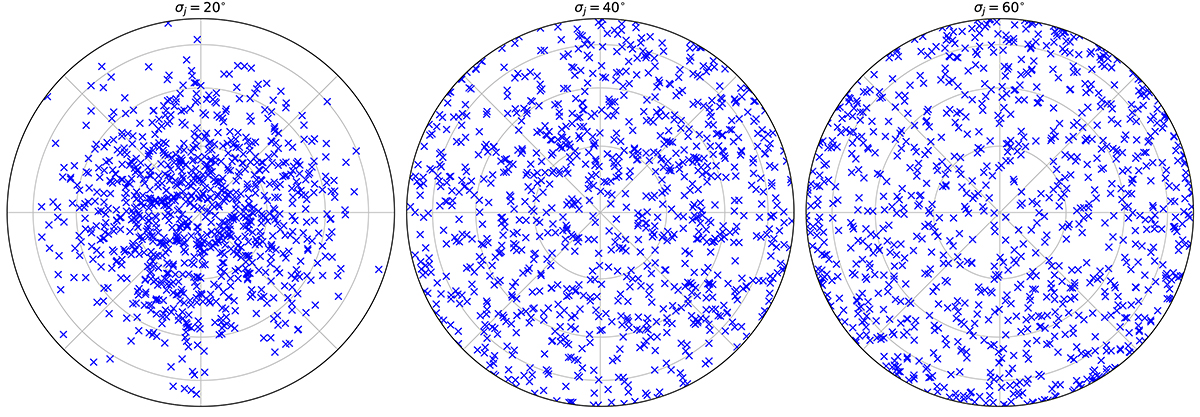
Distributions of the simulated jet pointings following Eq. (9) with different σj, 20°, 40°, and 60°. The LOS in each plot is along the minor axis of the galaxy, i.e. the crosses at the center correspond to jet pointing exactly towards the minor axis, while the crosses at the edge correspond to jet pointing perpendicular to the minor axis. The σj used in each panel is listed on top of the panel. Each plot contains 1000 different jet pointings. The inner big circles in each plots show angles of 20°, 40° and 60° with respect to the minor axis.
Current usage metrics show cumulative count of Article Views (full-text article views including HTML views, PDF and ePub downloads, according to the available data) and Abstracts Views on Vision4Press platform.
Data correspond to usage on the plateform after 2015. The current usage metrics is available 48-96 hours after online publication and is updated daily on week days.
Initial download of the metrics may take a while.