Open Access
Fig. 12.
Download original image
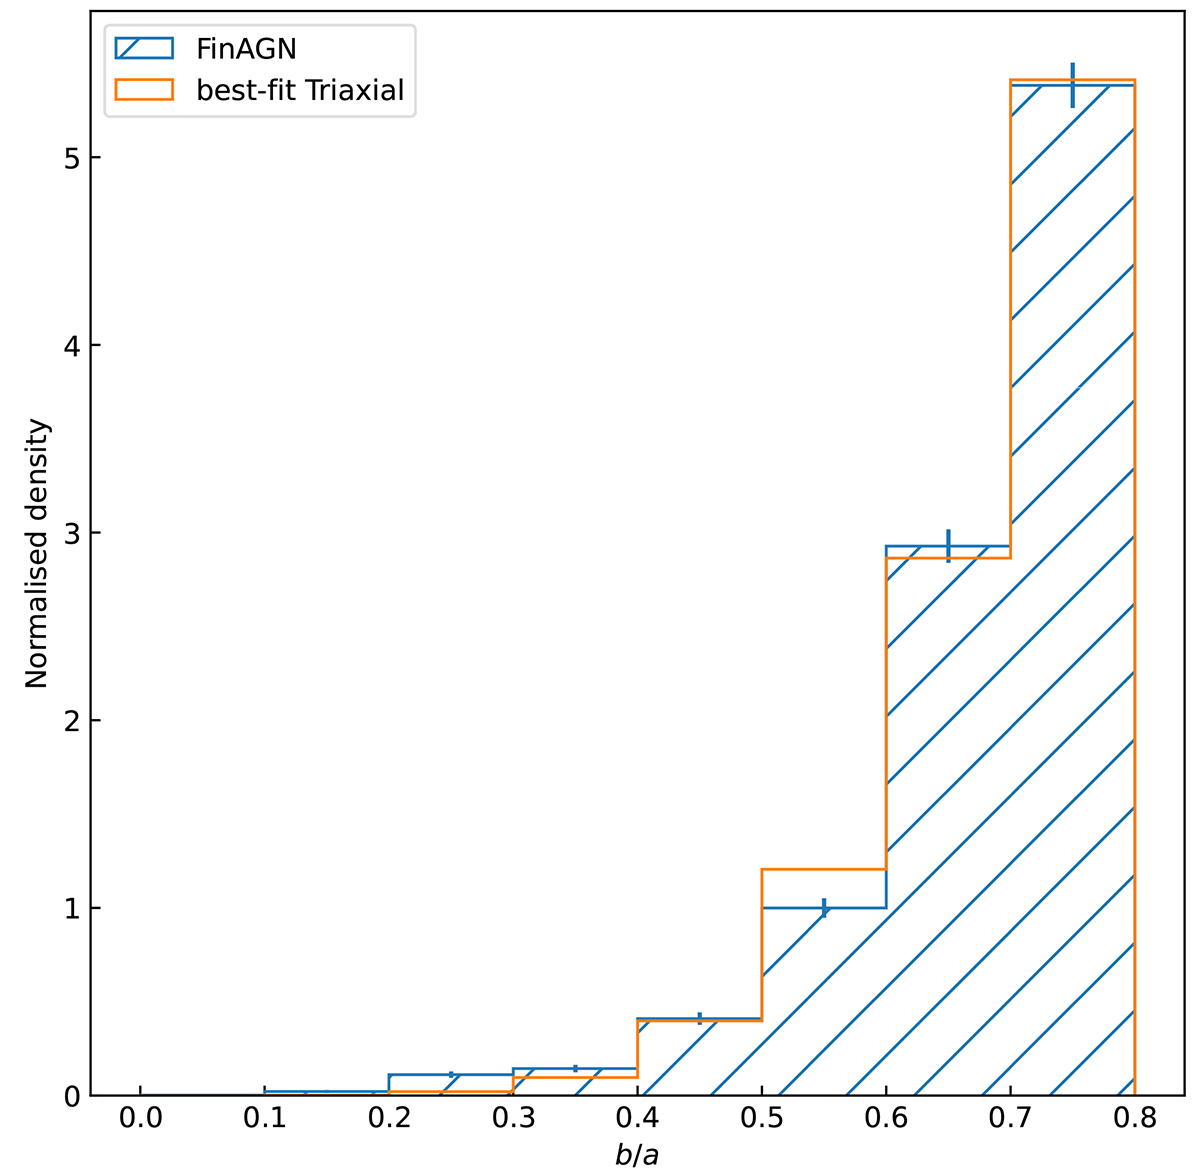
Normalised apparent axis ratio distributions for the FinAGN sample and the best-fit triaxial model. The blue hatch histogram denotes the FinAGN sample while the orange histogram denotes the triaxial model.
Current usage metrics show cumulative count of Article Views (full-text article views including HTML views, PDF and ePub downloads, according to the available data) and Abstracts Views on Vision4Press platform.
Data correspond to usage on the plateform after 2015. The current usage metrics is available 48-96 hours after online publication and is updated daily on week days.
Initial download of the metrics may take a while.