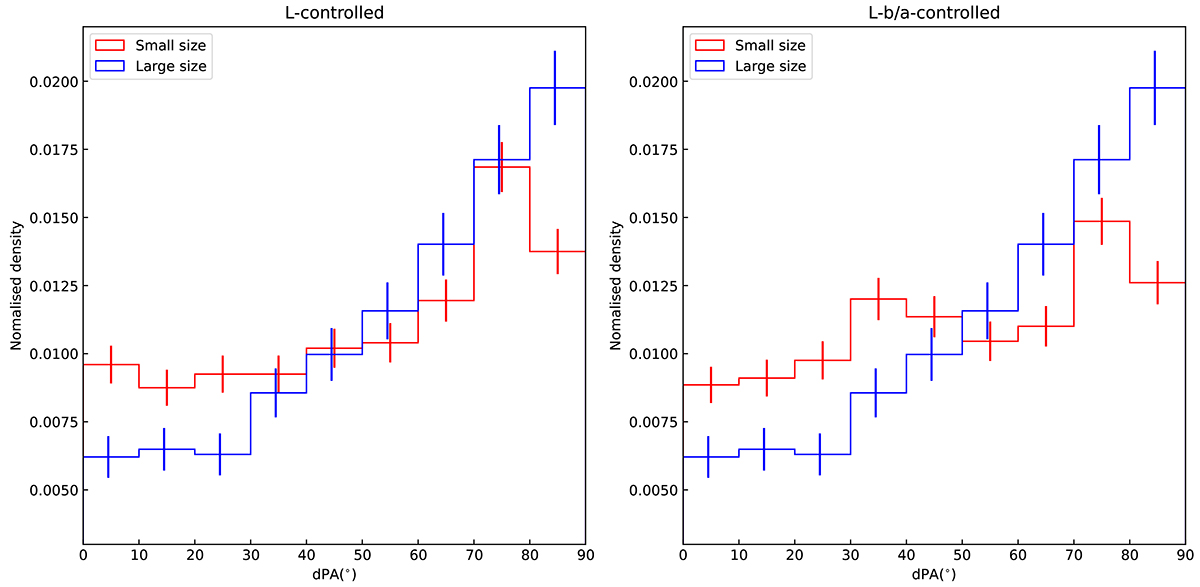
Fig. 11.
Download original image
Radio–optical misalignment angle distributions of radio-AGN with different projected linear size in samples with similar L150 MHz distribution or similar L150 MHz–b/a distribution. Left: dPA distributions of radio-AGNs with different projected linear size and similar L150 MHz distribution. Right: dPA distributions of radio-AGNs with different projected linear size and similar L150 MHz–b/a distribution. In both panels, the blue histograms denote radio-AGNs with large projected linear size (> 250 kpc) and the red histograms denote radio-AGNs with small size (≤250 kpc). The errorbars are slightly offset for clarity.
Current usage metrics show cumulative count of Article Views (full-text article views including HTML views, PDF and ePub downloads, according to the available data) and Abstracts Views on Vision4Press platform.
Data correspond to usage on the plateform after 2015. The current usage metrics is available 48-96 hours after online publication and is updated daily on week days.
Initial download of the metrics may take a while.