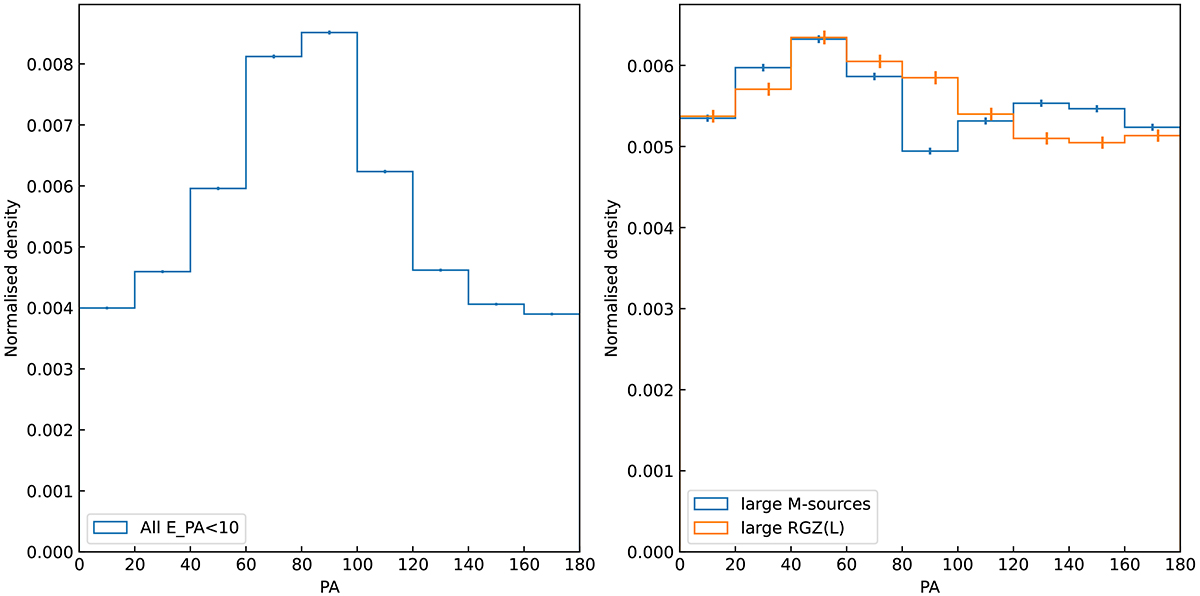
Fig. 1.
Download original image
Normalised distribution of RPAs in bins of 20° for the radio sources in the LoTSS DR2. The RPAs are based on the results from Hardcastle et al. (2023). The panel on the left shows the distribution of RPAs of radio sources in the LoTSS DR2 with PA errors smaller than 10°. The panel on the right shows the distribution of RPAs of the large multiple-Gaussian sources (noted as M-sources) and the large RGZ(L) sources. The blue histogram shows the RPA distribution of the large multiple-Gaussian sources with a valid deconvolved RPA and the red histogram shows the distribution of the large RGZ(L) sources. The two histograms are normalised to make the area of integration equal to one. The errorbars are derived from Poissonian errors.
Current usage metrics show cumulative count of Article Views (full-text article views including HTML views, PDF and ePub downloads, according to the available data) and Abstracts Views on Vision4Press platform.
Data correspond to usage on the plateform after 2015. The current usage metrics is available 48-96 hours after online publication and is updated daily on week days.
Initial download of the metrics may take a while.