Fig. 8
Download original image
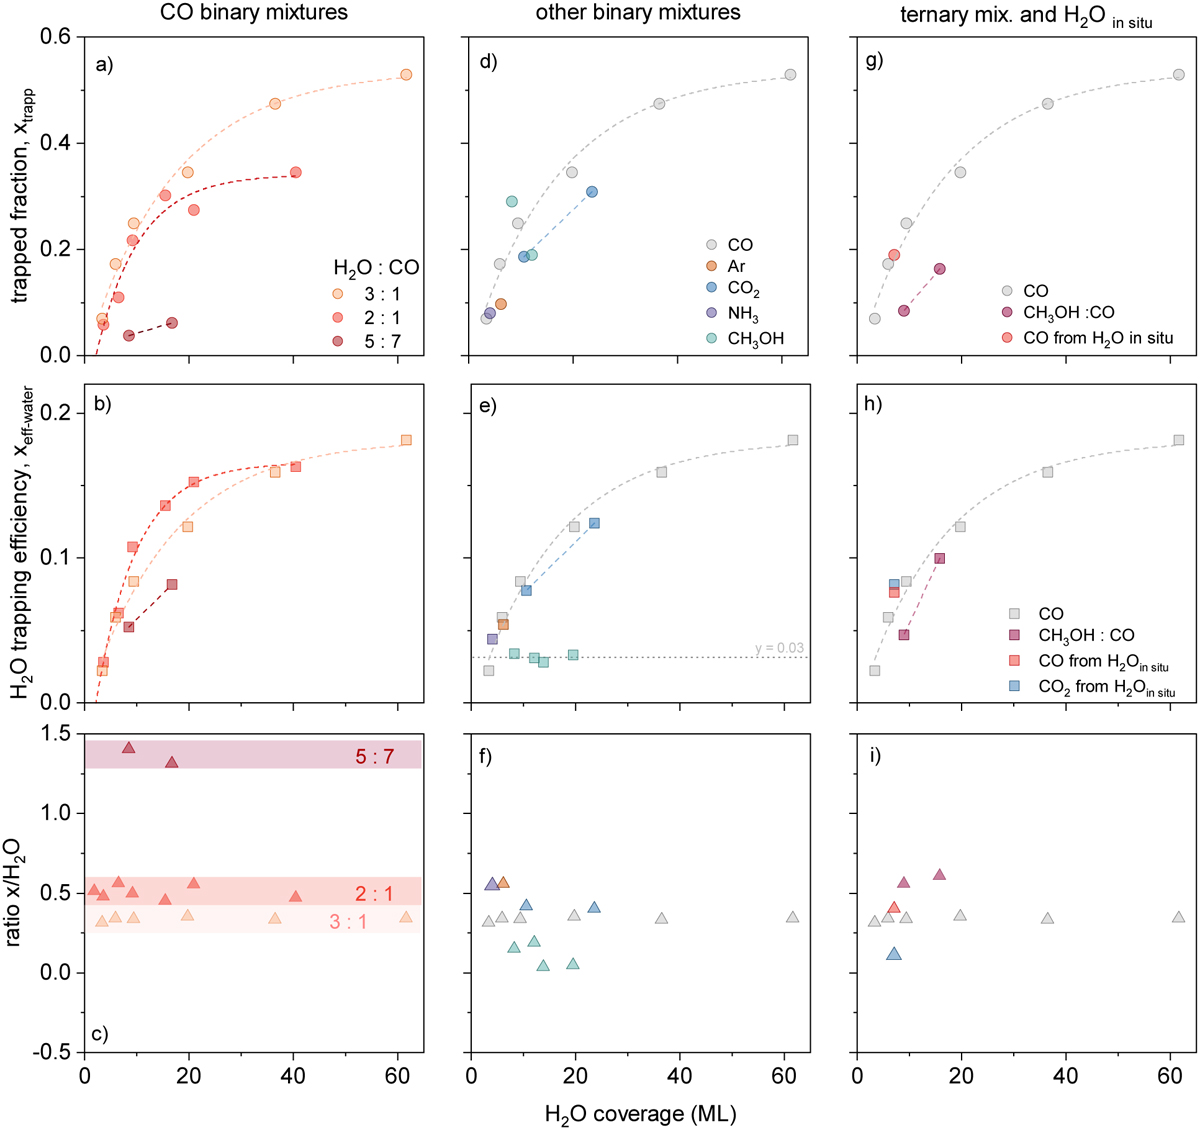
Comparative analysis of desorption yields in various ice mixtures. The trapped fraction (a, d, g) and the H2O trapping efficiency (b, e, h) as functions of H2O ice coverage, across CO binary mixtures, other binary mixtures, and for ternary mixtures and the in situ production of H2O, respectively. Panels c, f, and i show the deposition ratio for the corresponding systems. The dashed lines represent an exponential fit to the data, intended solely to assist visual interpretation. Dashed lines represent exponential and linear fits to the data, provided to assist visual interpretation and it is not meant to imply an underlying model.
Current usage metrics show cumulative count of Article Views (full-text article views including HTML views, PDF and ePub downloads, according to the available data) and Abstracts Views on Vision4Press platform.
Data correspond to usage on the plateform after 2015. The current usage metrics is available 48-96 hours after online publication and is updated daily on week days.
Initial download of the metrics may take a while.