Fig. 10
Download original image
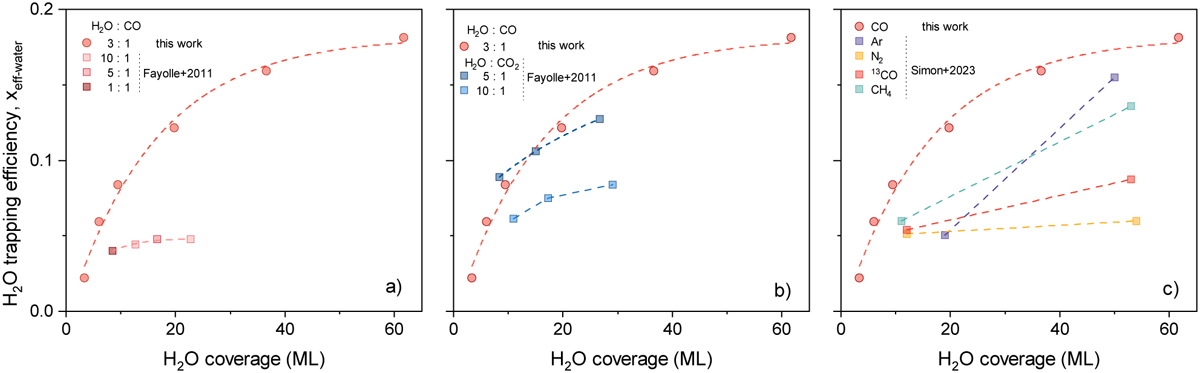
H2O trapping efficiency for volatile species as a function of H2O surface coverage. CO data from this study (circles) and literature (squares). (a) Variation with H2O to CO ratios, highlighting ice matrix porosity effects. (b) Comparable efficiencies for CO and CO2 due to ice structure. (c) Efficiency trends for hypervolatiles, including data on 13CO, CH4, and N2 from Simon et al. (2023).
Current usage metrics show cumulative count of Article Views (full-text article views including HTML views, PDF and ePub downloads, according to the available data) and Abstracts Views on Vision4Press platform.
Data correspond to usage on the plateform after 2015. The current usage metrics is available 48-96 hours after online publication and is updated daily on week days.
Initial download of the metrics may take a while.